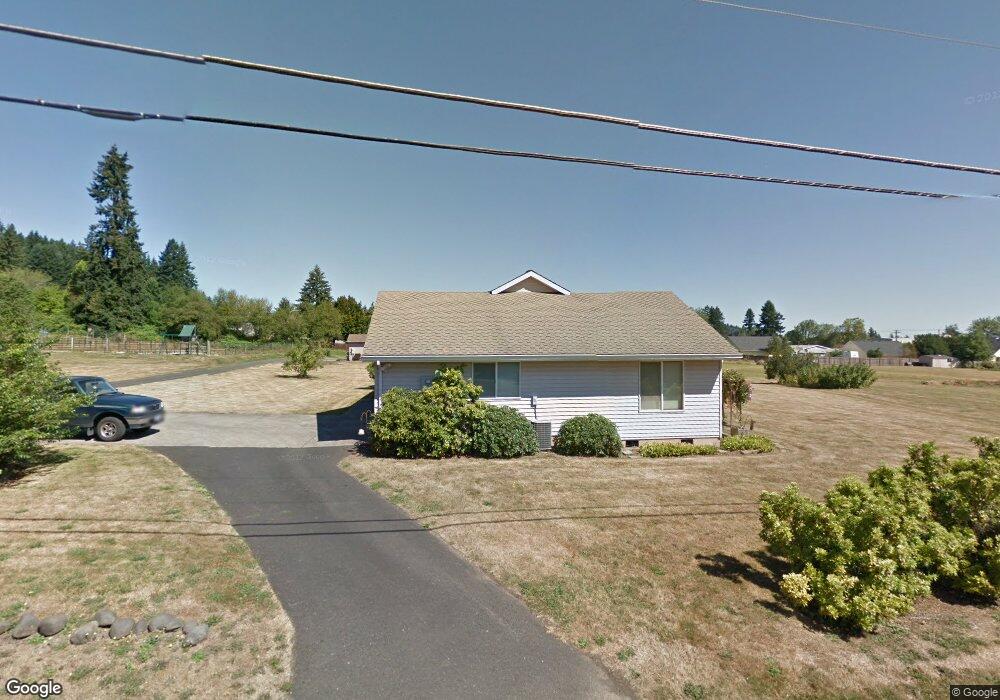
27379 SE Wally Rd Boring, OR 97009
Estimated Value: $600,000 - $643,000
Studio
2
Baths
1,956
Sq Ft
$316/Sq Ft
Est. Value
About This Home
This home is located at 27379 SE Wally Rd, Boring, OR 97009 and is currently estimated at $618,129, approximately $316 per square foot. 27379 SE Wally Rd is a home located in Clackamas County with nearby schools including Naas Elementary School, Boring Middle School, and Sandy High School.
Ownership History
Date
Name
Owned For
Owner Type
Purchase Details
Closed on
Mar 27, 2025
Sold by
Shields Steven and Shields Laura
Bought by
Meyer Garth W and Meyer Taylor L
Current Estimated Value
Home Financials for this Owner
Home Financials are based on the most recent Mortgage that was taken out on this home.
Original Mortgage
$410,000
Outstanding Balance
$407,545
Interest Rate
6.87%
Mortgage Type
New Conventional
Estimated Equity
$210,584
Purchase Details
Closed on
Dec 18, 2017
Sold by
Shields Laura
Bought by
Shields Steven and Shields Laura
Home Financials for this Owner
Home Financials are based on the most recent Mortgage that was taken out on this home.
Original Mortgage
$204,000
Interest Rate
3.94%
Mortgage Type
New Conventional
Purchase Details
Closed on
Sep 5, 2017
Sold by
Northrop Carol M
Bought by
Shields Laura
Purchase Details
Closed on
Nov 11, 1998
Sold by
Anderle Alfred A and Anderle Anne C
Bought by
Anderle Alfred A and Anderle Anne C
Create a Home Valuation Report for This Property
The Home Valuation Report is an in-depth analysis detailing your home's value as well as a comparison with similar homes in the area
Home Values in the Area
Average Home Value in this Area
Purchase History
| Date | Buyer | Sale Price | Title Company |
|---|---|---|---|
| Meyer Garth W | $605,000 | Wfg National Title | |
| Shields Steven | -- | None Available | |
| Shields Laura | -- | None Available | |
| Anderle Alfred A | -- | -- |
Source: Public Records
Mortgage History
| Date | Status | Borrower | Loan Amount |
|---|---|---|---|
| Open | Meyer Garth W | $410,000 | |
| Previous Owner | Shields Steven | $204,000 |
Source: Public Records
Tax History
| Year | Tax Paid | Tax Assessment Tax Assessment Total Assessment is a certain percentage of the fair market value that is determined by local assessors to be the total taxable value of land and additions on the property. | Land | Improvement |
|---|---|---|---|---|
| 2025 | $5,566 | $370,737 | -- | -- |
| 2024 | $5,321 | $359,939 | -- | -- |
| 2023 | $5,321 | $349,456 | -- | -- |
| 2022 | $4,865 | $339,278 | $0 | $0 |
| 2021 | $4,693 | $329,397 | $0 | $0 |
| 2020 | $4,577 | $319,803 | $0 | $0 |
| 2019 | $4,578 | $310,489 | $0 | $0 |
| 2018 | $4,389 | $301,446 | $0 | $0 |
| 2017 | $3,970 | $292,666 | $0 | $0 |
| 2016 | $3,792 | $284,142 | $0 | $0 |
| 2015 | $3,682 | $275,866 | $0 | $0 |
| 2014 | $3,559 | $267,831 | $0 | $0 |
Source: Public Records
Map
Nearby Homes
- 27677 SE Wally Rd
- 28380 SE Spring St
- 12840 SE 257th Ave
- 25150 SE Bohna Park Rd
- 29225 SE Haley Rd
- 14275 SE Holly View Terrace
- 11040 SE Mccreary Ln
- 0 SE Highway 212 Unit 387036591
- 0 SE Highway 212 Unit 523338612
- 9435 SE 282nd Ave
- 9600 SE Tower Dr
- 9690 SE 257th Dr
- 15550 SE Tickle Creek Rd
- 30425 SE Haley Rd
- 23322 SE Bohna Park Rd
- 29630 SE Wheeler Rd
- 29990 SE Knox Rd
- 28850 SE Stone Rd
- 3509 SW Battaglia Ave
- 30185 SE Wheeler Rd
- 27255 SE Wally Rd
- 27345 SE Wally Rd
- 27330 SE Wally Rd
- 27300 SE Wally Rd
- 27400 SE Wally Rd
- 27440 SE Wally Rd
- 0 SE Wally Rd
- 27211 SE Wally Rd
- 12810 SE 272nd Ave
- 27330 SE Fairmount Dr
- 12785 SE School Ave
- 12880 SE 272nd Ave
- 27320 SE Fairmount Dr
- 27315 SE Fireman Way
- 12815 SE School Ave
- 12725 SE School Ave
- 12620 SE 272nd Ave
- 12503 Forest
- 12719 SE School Ave
- 12751 SE 272nd Ave
Your Personal Tour Guide
Ask me questions while you tour the home.