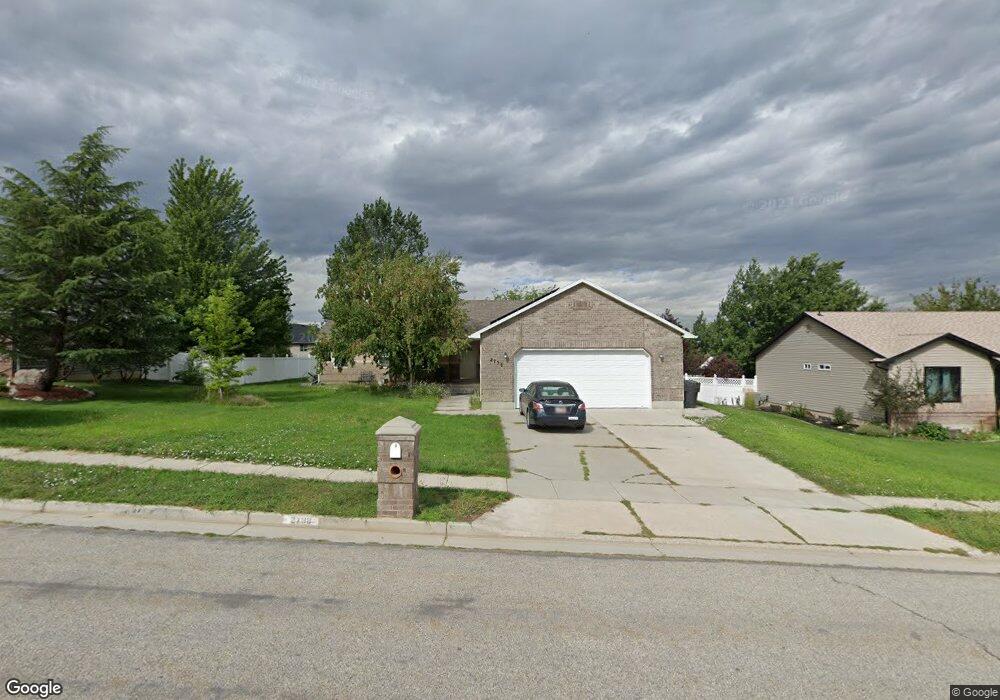
2738 S 725 W Brigham City, UT 84302
Estimated Value: $266,000 - $355,000
--
Bed
--
Bath
640
Sq Ft
$482/Sq Ft
Est. Value
About This Home
This home is located at 2738 S 725 W, Brigham City, UT 84302 and is currently estimated at $308,422, approximately $481 per square foot. 2738 S 725 W is a home located in Box Elder County with nearby schools including Three Mile Creek School, Adele C. Young Intermediate School, and Box Elder Middle School.
Ownership History
Date
Name
Owned For
Owner Type
Purchase Details
Closed on
Dec 15, 2020
Sold by
Leishman Gregory J
Bought by
Leishman Gregory J and Leishman Sherie W
Current Estimated Value
Home Financials for this Owner
Home Financials are based on the most recent Mortgage that was taken out on this home.
Original Mortgage
$83,000
Outstanding Balance
$61,098
Interest Rate
2.7%
Mortgage Type
New Conventional
Estimated Equity
$247,324
Purchase Details
Closed on
Apr 16, 2015
Sold by
Bcu Investments Llc
Bought by
Leishman Gregory J
Home Financials for this Owner
Home Financials are based on the most recent Mortgage that was taken out on this home.
Original Mortgage
$103,170
Interest Rate
3.7%
Mortgage Type
New Conventional
Purchase Details
Closed on
Jul 12, 2012
Sold by
Mccrea Daniel B and Mccrea Donna L
Bought by
Gonzales Joel J
Home Financials for this Owner
Home Financials are based on the most recent Mortgage that was taken out on this home.
Original Mortgage
$90,306
Interest Rate
3.7%
Mortgage Type
New Conventional
Create a Home Valuation Report for This Property
The Home Valuation Report is an in-depth analysis detailing your home's value as well as a comparison with similar homes in the area
Home Values in the Area
Average Home Value in this Area
Purchase History
| Date | Buyer | Sale Price | Title Company |
|---|---|---|---|
| Leishman Gregory J | -- | Accommodation | |
| Leishman Gregory J | -- | Amer Secure Title Brigham Ci | |
| Gonzales Joel J | -- | American Secure Title Grigha |
Source: Public Records
Mortgage History
| Date | Status | Borrower | Loan Amount |
|---|---|---|---|
| Open | Leishman Gregory J | $83,000 | |
| Closed | Leishman Gregory J | $103,170 | |
| Previous Owner | Gonzales Joel J | $90,306 |
Source: Public Records
Tax History Compared to Growth
Tax History
| Year | Tax Paid | Tax Assessment Tax Assessment Total Assessment is a certain percentage of the fair market value that is determined by local assessors to be the total taxable value of land and additions on the property. | Land | Improvement |
|---|---|---|---|---|
| 2025 | $1,286 | $255,052 | $105,000 | $150,052 |
| 2024 | $1,286 | $247,661 | $100,000 | $147,661 |
| 2023 | $1,269 | $250,195 | $95,000 | $155,195 |
| 2022 | $1,202 | $121,129 | $22,000 | $99,129 |
| 2021 | $965 | $141,995 | $40,000 | $101,995 |
| 2020 | $874 | $141,995 | $40,000 | $101,995 |
| 2019 | $829 | $71,644 | $22,000 | $49,644 |
| 2018 | $758 | $65,168 | $22,000 | $43,168 |
| 2017 | $665 | $98,997 | $16,500 | $68,997 |
| 2016 | $700 | $52,642 | $16,500 | $36,142 |
| 2015 | $587 | $43,841 | $16,500 | $27,341 |
| 2014 | $587 | $42,539 | $16,500 | $26,039 |
| 2013 | -- | $42,539 | $16,500 | $26,039 |
Source: Public Records
Map
Nearby Homes
- 995 W 2650 S
- 2925 S Highway 89
- 2925 S Highway 89 Unit 15
- 2925 S Highway 89 Unit 12
- 3250 S Highway 89
- 2550 Peach St
- 2980 S Highway 89
- 2975 S 1080 W
- 619 W 2300 S Unit 8
- 2277 S 525 W
- 2285 S 450 W
- 2263 S 450 W
- 2230 S 635 W Unit C
- 2230 S 635 W Unit D
- 2230 S 635 W Unit B
- 280 W 2400 S
- 1273 W 3200 S Unit 6
- 2460 S 1350 W
- 1257 W 3275 S
- 1480 W 3275 S