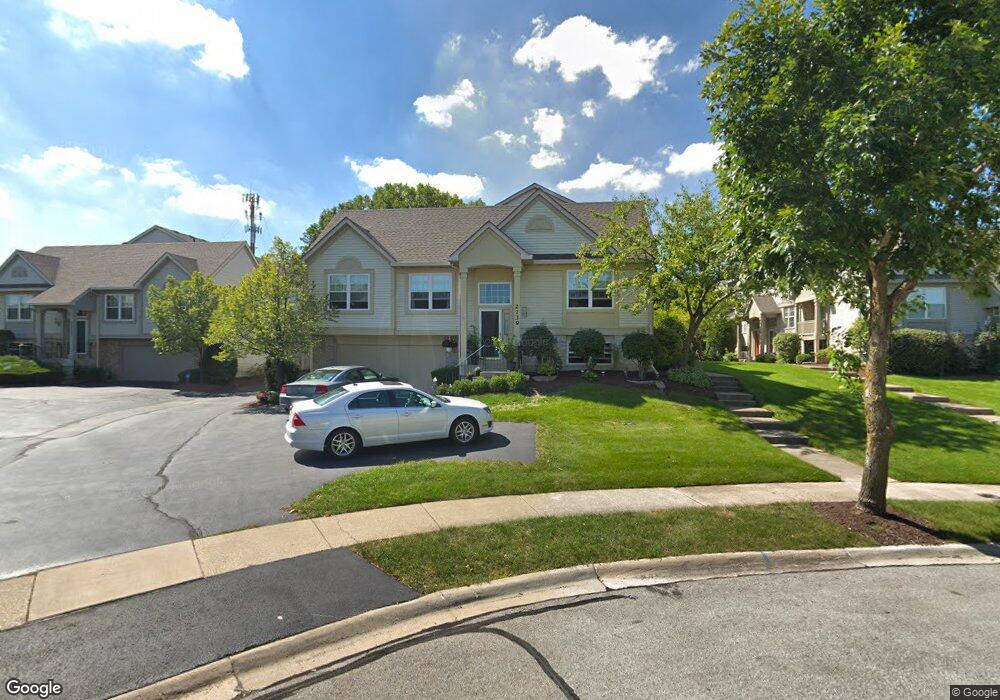
2739 Curran Ct Unit 137 Darien, IL 60561
Estimated Value: $367,000 - $388,000
2
Beds
2
Baths
1,644
Sq Ft
$228/Sq Ft
Est. Value
About This Home
This home is located at 2739 Curran Ct Unit 137, Darien, IL 60561 and is currently estimated at $374,276, approximately $227 per square foot. 2739 Curran Ct Unit 137 is a home located in DuPage County with nearby schools including Prairieview Elementary School, Elizabeth Ide Elementary School, and Lakeview Jr High School.
Ownership History
Date
Name
Owned For
Owner Type
Purchase Details
Closed on
Jan 22, 2007
Sold by
Odonnell Edward and Zborek Maryann
Bought by
State Bank Of Countryside and Trust #07-2921
Current Estimated Value
Purchase Details
Closed on
May 26, 2006
Sold by
Ferre Charles F
Bought by
Odonnell Edward and Zborek Maryann
Home Financials for this Owner
Home Financials are based on the most recent Mortgage that was taken out on this home.
Original Mortgage
$150,000
Interest Rate
6.62%
Mortgage Type
Fannie Mae Freddie Mac
Purchase Details
Closed on
Apr 22, 2004
Sold by
Ferre Charles F
Bought by
Ferre Charles F and Charles F Ferre Living Trust
Purchase Details
Closed on
Nov 5, 1997
Sold by
United Homes Inc
Bought by
Ferre Charles F
Home Financials for this Owner
Home Financials are based on the most recent Mortgage that was taken out on this home.
Original Mortgage
$100,000
Interest Rate
7.42%
Mortgage Type
Balloon
Create a Home Valuation Report for This Property
The Home Valuation Report is an in-depth analysis detailing your home's value as well as a comparison with similar homes in the area
Home Values in the Area
Average Home Value in this Area
Purchase History
| Date | Buyer | Sale Price | Title Company |
|---|---|---|---|
| State Bank Of Countryside | -- | None Available | |
| Odonnell Edward | $259,000 | First American Title | |
| Ferre Charles F | -- | -- | |
| Ferre Charles F | $151,000 | -- |
Source: Public Records
Mortgage History
| Date | Status | Borrower | Loan Amount |
|---|---|---|---|
| Previous Owner | Odonnell Edward | $150,000 | |
| Previous Owner | Ferre Charles F | $100,000 |
Source: Public Records
Tax History Compared to Growth
Tax History
| Year | Tax Paid | Tax Assessment Tax Assessment Total Assessment is a certain percentage of the fair market value that is determined by local assessors to be the total taxable value of land and additions on the property. | Land | Improvement |
|---|---|---|---|---|
| 2024 | $4,812 | $99,642 | $24,421 | $75,221 |
| 2023 | $4,535 | $91,600 | $22,450 | $69,150 |
| 2022 | $4,549 | $87,570 | $21,460 | $66,110 |
| 2021 | $4,165 | $86,580 | $21,220 | $65,360 |
| 2020 | $4,082 | $84,870 | $20,800 | $64,070 |
| 2019 | $3,917 | $81,440 | $19,960 | $61,480 |
| 2018 | $4,015 | $81,850 | $20,060 | $61,790 |
| 2017 | $3,996 | $78,760 | $19,300 | $59,460 |
| 2016 | $3,780 | $75,170 | $18,420 | $56,750 |
| 2015 | $3,684 | $70,720 | $17,330 | $53,390 |
| 2014 | $3,855 | $70,160 | $17,190 | $52,970 |
| 2013 | $3,900 | $69,830 | $17,110 | $52,720 |
Source: Public Records
Map
Nearby Homes
- 2667 Woodmere Dr Unit 44
- 2611 Woodmere Dr Unit 24
- 7911 Hedgewood Dr
- 2714 Whitlock Dr
- 8250 Lemont Rd
- 8240 Lemont Rd
- 1340 83rd St
- 8269 Meadowwood Ave
- 2417 Green Valley Rd
- 1133 Central Ave
- 7925 Fairmount Ave
- 7625 Dunham Rd
- 960 86th St
- 7517 Main St
- 7769 Danbury Dr
- 7930 Woodglen Ln Unit 204
- 7501 Cambridge Rd
- 8000 Woodglen Ln Unit 101
- 8620 Washington St
- 8100 Woodglen Ln Unit 204
- 2731 Curran Ct Unit 141
- 2733 Curran Ct Unit 140
- 2731 Curran Ct Unit 2731
- 2731 Curran Ct Unit 1
- 2737 Curran Ct Unit 138
- 2735 Curran Ct Unit 139
- 2727 Curran Ct Unit 133
- 2727 Curran Ct Unit 1
- 2741 Woodmere Dr Unit 147
- 2743 Woodmere Dr Unit 144
- 2747 Woodmere Dr Unit 142
- 2745 Woodmere Dr Unit 143
- 2721 Curran Ct Unit 136
- 2725 Curran Ct Unit 134
- 2723 Curran Ct Unit 135
- 2713 Curran Ct Unit 130
- 2711 Curran Ct Unit 129
- 2715 Curran Ct Unit 131
- 2717 Curran Ct Unit 132
- 2751 Woodmere Dr Unit 149