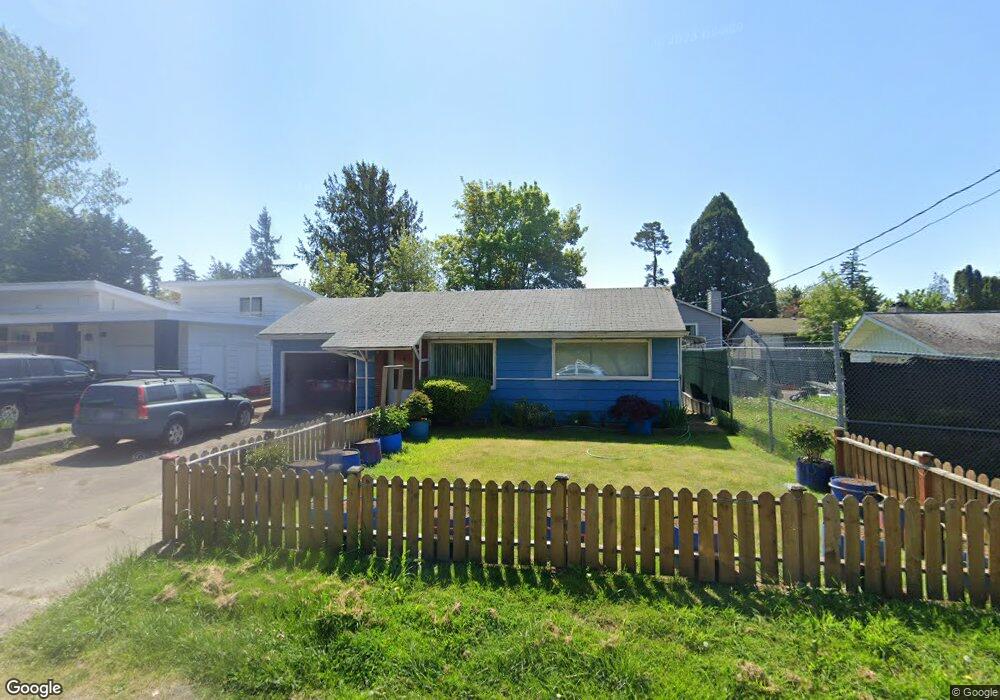
2739 Mcleod Rd Bellingham, WA 98225
Birchwood NeighborhoodEstimated Value: $408,000 - $551,000
2
Beds
1
Bath
704
Sq Ft
$674/Sq Ft
Est. Value
About This Home
This home is located at 2739 Mcleod Rd, Bellingham, WA 98225 and is currently estimated at $474,303, approximately $673 per square foot. 2739 Mcleod Rd is a home located in Whatcom County with nearby schools including Birchwood Elementary School, Shuksan Middle School, and Bellingham High School.
Ownership History
Date
Name
Owned For
Owner Type
Purchase Details
Closed on
May 20, 2005
Sold by
Johnson Katie M and Geri Todd D
Bought by
Tran Thinh
Current Estimated Value
Home Financials for this Owner
Home Financials are based on the most recent Mortgage that was taken out on this home.
Original Mortgage
$139,840
Outstanding Balance
$72,913
Interest Rate
5.84%
Mortgage Type
Fannie Mae Freddie Mac
Estimated Equity
$401,390
Purchase Details
Closed on
Jan 16, 2004
Sold by
Pacific Homes/Homequest Inc
Bought by
Johnson Katie M and Geri Todd D
Home Financials for this Owner
Home Financials are based on the most recent Mortgage that was taken out on this home.
Original Mortgage
$135,178
Interest Rate
5.86%
Mortgage Type
FHA
Purchase Details
Closed on
Aug 28, 2003
Sold by
Hartry Timothy P and Lavandier Mary
Bought by
Pacific Homes/Homequest Inc
Create a Home Valuation Report for This Property
The Home Valuation Report is an in-depth analysis detailing your home's value as well as a comparison with similar homes in the area
Home Values in the Area
Average Home Value in this Area
Purchase History
| Date | Buyer | Sale Price | Title Company |
|---|---|---|---|
| Tran Thinh | $174,800 | Stewart Title Company | |
| Johnson Katie M | $137,300 | First American Title Ins | |
| Pacific Homes/Homequest Inc | -- | Stewart Title Company |
Source: Public Records
Mortgage History
| Date | Status | Borrower | Loan Amount |
|---|---|---|---|
| Open | Tran Thinh | $139,840 | |
| Previous Owner | Johnson Katie M | $135,178 | |
| Closed | Tran Thinh | $15,000 |
Source: Public Records
Tax History Compared to Growth
Tax History
| Year | Tax Paid | Tax Assessment Tax Assessment Total Assessment is a certain percentage of the fair market value that is determined by local assessors to be the total taxable value of land and additions on the property. | Land | Improvement |
|---|---|---|---|---|
| 2024 | $3,052 | $375,414 | $218,015 | $157,399 |
| 2023 | $3,052 | $391,921 | $227,601 | $164,320 |
| 2022 | $2,639 | $343,790 | $199,650 | $144,140 |
| 2021 | $2,318 | $284,124 | $165,000 | $119,124 |
| 2020 | $2,241 | $235,482 | $110,986 | $124,496 |
| 2019 | $2,004 | $220,048 | $103,776 | $116,272 |
| 2018 | $2,074 | $197,372 | $93,088 | $104,284 |
| 2017 | $1,804 | $174,636 | $82,365 | $92,271 |
| 2016 | $1,650 | $158,754 | $74,955 | $83,799 |
| 2015 | $1,697 | $151,173 | $71,250 | $79,923 |
| 2014 | -- | $150,411 | $61,920 | $88,491 |
| 2013 | -- | $144,257 | $60,000 | $84,257 |
Source: Public Records
Map
Nearby Homes
- 2833 Mcleod Rd
- 2721 Mcleod Rd
- 2817 Mcleod Rd
- 2710 Mcleod Rd
- 3350 Northwest Ave Unit 1102
- 3352 Northwest Ave Unit 2101
- 2850 W Maplewood Ave
- 3330 Northwest Ave
- 4015 Eliza Ave Unit 120
- 4015 Eliza Ave Unit 31
- 2715 W Maplewood Ave Unit 122
- 2713 W Maplewood Ave Unit 311
- 0 Home Ln
- 2829 Cottonwood Ave
- 3085 W Maplewood Ave
- 3057 Mcleod Rd
- 617 Sunflower Ln Unit E2
- 4506 Meridian St
- 259 W Bakerview Rd Unit C102
- 259 W Bakerview Rd Unit C203
- 2737 Mcleod Rd
- 2745 Mcleod Rd
- 3538 NW Ave #6
- 3538 Northwest Ave
- 3538 Northwest Ave Unit 33
- 3538 Northwest Ave Unit 32
- 3538 Northwest Ave Unit 30
- 3538 Northwest Ave Unit 28
- 3538 Northwest Ave Unit 27
- 3538 Northwest Ave Unit 26
- 3538 Northwest Ave Unit 25
- 3538 Northwest Ave Unit 6
- 3538 Northwest Ave Unit 5
- 3538 Northwest Ave Unit 4
- 3538 Northwest Ave Unit 3
- 3538 Northwest Ave Unit 2
- 3538 Northwest Ave Unit 1
- 3538 Northwest Ave Unit 44
- 3538 Northwest Ave Unit 43