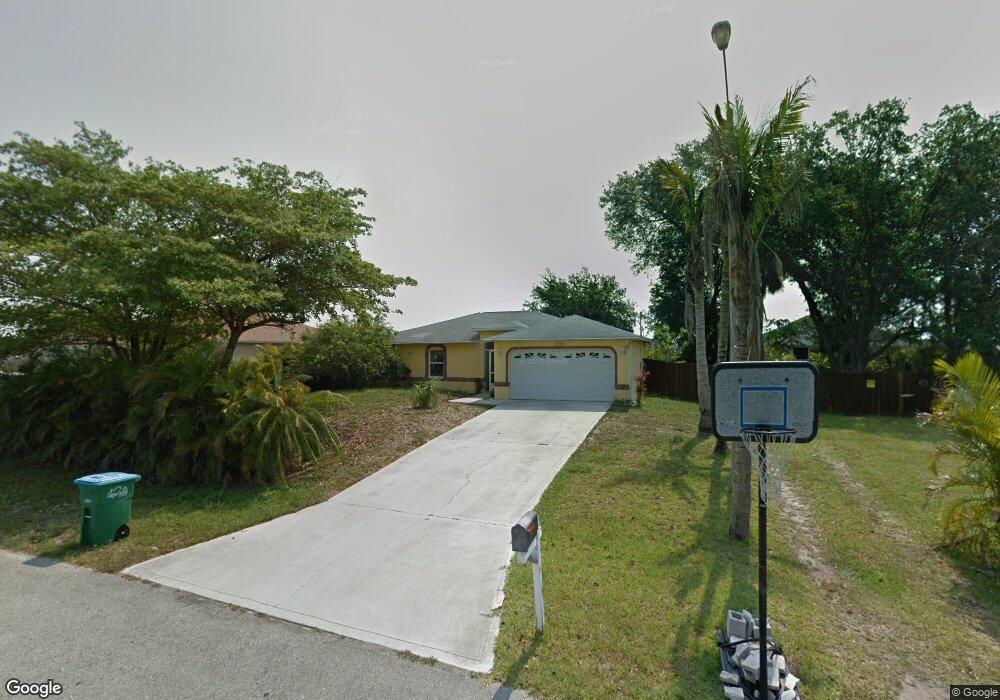
2739 NE 4th Place Cape Coral, FL 33909
Diplomat NeighborhoodEstimated Value: $307,000 - $405,000
3
Beds
2
Baths
1,722
Sq Ft
$197/Sq Ft
Est. Value
About This Home
This home is located at 2739 NE 4th Place, Cape Coral, FL 33909 and is currently estimated at $338,944, approximately $196 per square foot. 2739 NE 4th Place is a home located in Lee County with nearby schools including Dr. Carrie D. Robinson Littleton Elementary School, Caloosa Elementary School, and Tropic Isles Elementary School.
Ownership History
Date
Name
Owned For
Owner Type
Purchase Details
Closed on
Aug 7, 2017
Sold by
Echeverri Rolando
Bought by
Robinson Lucero Katia R
Current Estimated Value
Home Financials for this Owner
Home Financials are based on the most recent Mortgage that was taken out on this home.
Original Mortgage
$206,196
Outstanding Balance
$172,055
Interest Rate
3.96%
Mortgage Type
FHA
Estimated Equity
$166,889
Purchase Details
Closed on
May 19, 2004
Sold by
Lucero Robinson Lucrecia
Bought by
Robinson Brian D and Lucero Robinson Lucrecia
Purchase Details
Closed on
Jul 8, 1997
Sold by
Bendezu Marco and Bendezu Marco E
Bought by
Lucero Lucrecia M
Home Financials for this Owner
Home Financials are based on the most recent Mortgage that was taken out on this home.
Original Mortgage
$63,000
Interest Rate
7.98%
Create a Home Valuation Report for This Property
The Home Valuation Report is an in-depth analysis detailing your home's value as well as a comparison with similar homes in the area
Home Values in the Area
Average Home Value in this Area
Purchase History
| Date | Buyer | Sale Price | Title Company |
|---|---|---|---|
| Robinson Lucero Katia R | $210,000 | Townsend Title Ins Agency Ll | |
| Robinson Brian D | $32,000 | -- | |
| Lucero Lucrecia M | $65,000 | -- |
Source: Public Records
Mortgage History
| Date | Status | Borrower | Loan Amount |
|---|---|---|---|
| Open | Robinson Lucero Katia R | $206,196 | |
| Previous Owner | Lucero Lucrecia M | $63,000 |
Source: Public Records
Tax History Compared to Growth
Tax History
| Year | Tax Paid | Tax Assessment Tax Assessment Total Assessment is a certain percentage of the fair market value that is determined by local assessors to be the total taxable value of land and additions on the property. | Land | Improvement |
|---|---|---|---|---|
| 2025 | $1,893 | $98,098 | -- | -- |
| 2024 | $1,893 | $95,333 | -- | -- |
| 2023 | $1,760 | $92,556 | $0 | $0 |
| 2022 | $1,569 | $89,860 | $0 | $0 |
| 2021 | $1,507 | $184,854 | $22,433 | $162,421 |
| 2020 | $1,487 | $86,038 | $0 | $0 |
| 2019 | $1,240 | $72,321 | $0 | $0 |
| 2018 | $1,228 | $70,973 | $0 | $0 |
| 2017 | $1,221 | $69,513 | $0 | $0 |
| 2016 | $1,160 | $136,101 | $18,934 | $117,167 |
| 2015 | $1,131 | $117,406 | $17,111 | $100,295 |
| 2014 | -- | $106,704 | $15,683 | $91,021 |
| 2013 | -- | $95,985 | $8,200 | $87,785 |
Source: Public Records
Map
Nearby Homes
- 2720 NE 5th Ave
- 2739 NE 5th Ave
- 2817 NE 4th Ave
- 2821 NE 4th Place
- 2733 NE 5th Place
- 2812 NE 5th Place
- 2816 NE 5th Place
- 2807 NE 5th Place
- 2711 NE 5th Place
- 329 NE 27th St Unit 36
- 2707 NE 5th Place
- 2904 NE 5th Ave
- 2710 NE 6th Ave
- 2814 NE 6th Ave
- 322 NE 27th St
- 2831 NE 5th Place
- 2613 NE 5th Place
- 2804 NE 3rd Ave
- 305 NE 27th St
- 2737 NE 2nd Place
- 2743 NE 4th Place
- 2736 NE 5th Ave
- 2736 NE 4th Place
- 2744 NE 5th Ave
- 2732 NE 5th Ave
- 2740 NE 4th Place Unit 36
- 2740 NE 4th Place
- 2727 NE 4th Place
- 2747 NE 4th Place
- 2728 NE 5th Ave
- 2728 NE 4th Place
- 2728 NE 4 Place
- 2723 NE 4th Place Unit 3
- 2748 NE 5th Ave
- 2737 NE 4th Ave
- 2724 NE 4th Place
- 2735 NE 5th Ave
- 2724 NE 5th Ave
- 2733 NE 4th Ave
- 2731 NE 5th Ave