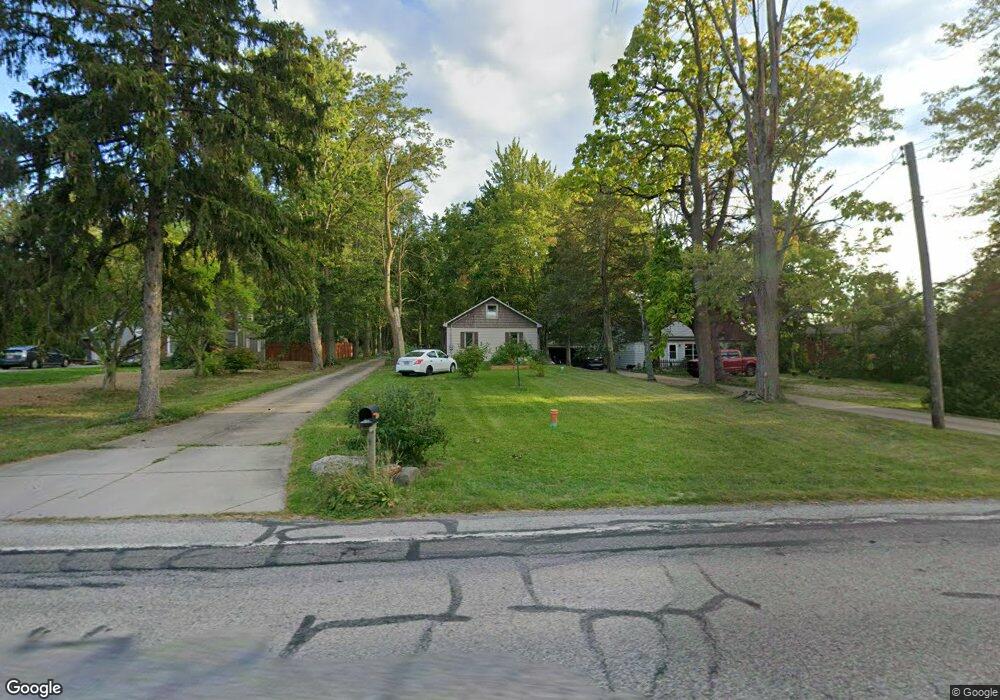
27397 Cook Rd Olmsted Township, OH 44138
Estimated Value: $181,000 - $280,000
3
Beds
1
Bath
1,200
Sq Ft
$181/Sq Ft
Est. Value
About This Home
This home is located at 27397 Cook Rd, Olmsted Township, OH 44138 and is currently estimated at $217,107, approximately $180 per square foot. 27397 Cook Rd is a home located in Cuyahoga County with nearby schools including Olmsted Falls Intermediate Building, Falls-Lenox Primary Elementary School, and Olmsted Falls Middle School.
Ownership History
Date
Name
Owned For
Owner Type
Purchase Details
Closed on
May 30, 2020
Sold by
Waken Daniel and Waken Gayle
Bought by
Waken Benjamin A
Current Estimated Value
Home Financials for this Owner
Home Financials are based on the most recent Mortgage that was taken out on this home.
Original Mortgage
$72,000
Outstanding Balance
$63,822
Interest Rate
3.2%
Mortgage Type
New Conventional
Estimated Equity
$153,285
Purchase Details
Closed on
Sep 10, 2019
Sold by
Spanulo Carla A
Bought by
Waken Daniel and Waken Gayle
Purchase Details
Closed on
Jul 15, 2019
Sold by
Estate Of Michael J Spanulo
Bought by
Spanulo Carla A
Purchase Details
Closed on
Feb 27, 1987
Sold by
Spanulo Michael J
Bought by
Spanulo Michael J and Spanulo Carla A
Purchase Details
Closed on
Jun 13, 1977
Sold by
Spanulo Rudolph J and Spanulo Anna M
Bought by
Spanulo Michael J
Purchase Details
Closed on
Jan 1, 1975
Bought by
Spanulo Rudolph J and Spanulo Anna M
Create a Home Valuation Report for This Property
The Home Valuation Report is an in-depth analysis detailing your home's value as well as a comparison with similar homes in the area
Home Values in the Area
Average Home Value in this Area
Purchase History
| Date | Buyer | Sale Price | Title Company |
|---|---|---|---|
| Waken Benjamin A | $90,000 | Black Tie Title | |
| Waken Daniel | $87,000 | Guardian Title | |
| Spanulo Carla A | -- | Guardian Title | |
| Spanulo Michael J | -- | -- | |
| Spanulo Michael J | -- | -- | |
| Spanulo Rudolph J | -- | -- |
Source: Public Records
Mortgage History
| Date | Status | Borrower | Loan Amount |
|---|---|---|---|
| Open | Waken Benjamin A | $72,000 |
Source: Public Records
Tax History Compared to Growth
Tax History
| Year | Tax Paid | Tax Assessment Tax Assessment Total Assessment is a certain percentage of the fair market value that is determined by local assessors to be the total taxable value of land and additions on the property. | Land | Improvement |
|---|---|---|---|---|
| 2024 | $4,145 | $52,150 | $14,455 | $37,695 |
| 2023 | $4,413 | $45,820 | $11,200 | $34,620 |
| 2022 | $4,377 | $45,815 | $11,200 | $34,615 |
| 2021 | $4,091 | $45,820 | $11,200 | $34,620 |
| 2020 | $3,953 | $38,500 | $9,420 | $29,090 |
| 2019 | $3,619 | $110,000 | $26,900 | $83,100 |
| 2018 | $3,235 | $38,500 | $9,420 | $29,090 |
| 2017 | $3,014 | $31,820 | $7,670 | $24,150 |
| 2016 | $2,998 | $31,820 | $7,670 | $24,150 |
| 2015 | $3,302 | $31,820 | $7,670 | $24,150 |
| 2014 | $3,302 | $31,820 | $7,670 | $24,150 |
Source: Public Records
Map
Nearby Homes
- 21A Willow Woods Dr
- 12A Willow Woods Dr
- 29A Willow Woods Dr
- 12B Willow Woods Dr
- 0 Bronson Rd Unit 5162858
- V/L Bronson Rd
- 0 Bronson Rd Unit 5162853
- 30241 Sugar Sand Ln Unit 14B
- 27261 Cook Rd
- 7100 Barton Rd
- 32801 Lorain Rd
- 31134 Lorain Rd
- 7865 Bliss Pkwy
- 6580 Barton Rd
- 29861 Wellington Dr
- 33531 Dickens Cir
- 6617 Sutton Dr
- 30630 Lorain Rd
- 0 Bagley Rd
- 27218 Bagley Rd
- 27399 Cook Rd
- 27395 Cook Rd
- 27393 Cook Rd
- 27403 Cook Rd
- 27389 Cook Rd
- 27387 Cook Rd
- 27386 Cook Rd
- 31615 Cook Rd
- 27390 Cook Rd
- 27383 Cook Rd
- 27382 Cook Rd
- 27375 Cook Rd
- 31684 Cook Rd
- 27380 Cook Rd Unit 1
- 27380 Cook Rd Unit 2
- 27380 Cook Rd Unit 23 2
- 27380 Cook Rd Unit 23 1
- 27380 Cook Rd
- 7454 Bronson Rd
- 31735 Cook Rd