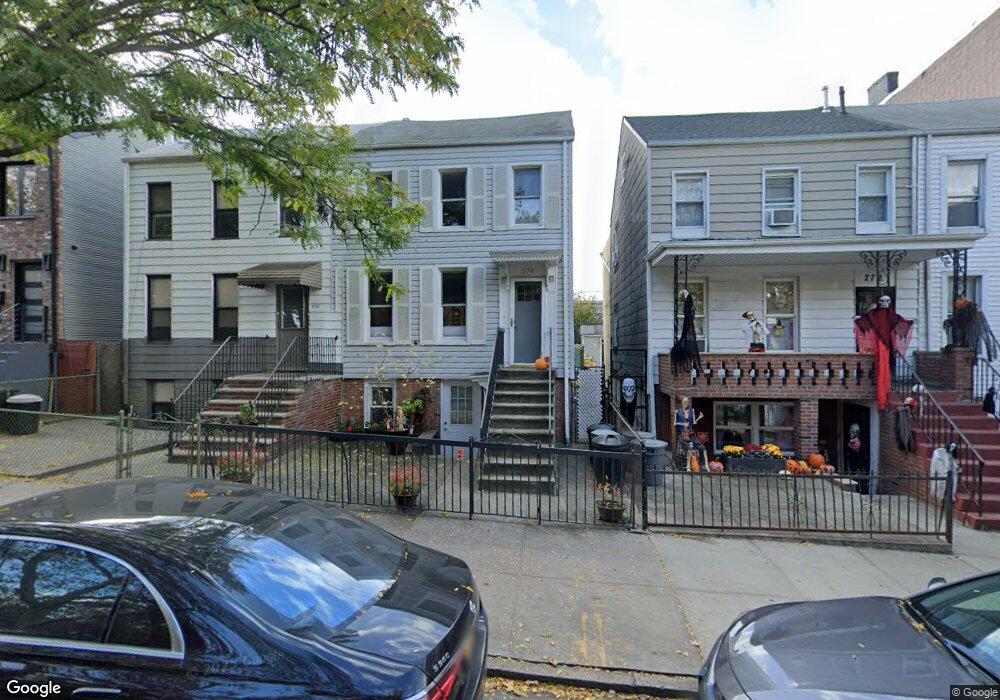
274 17th St Brooklyn, NY 11215
South Slope NeighborhoodEstimated Value: $2,233,000 - $2,665,599
Studio
--
Bath
2,753
Sq Ft
$883/Sq Ft
Est. Value
About This Home
This home is located at 274 17th St, Brooklyn, NY 11215 and is currently estimated at $2,431,900, approximately $883 per square foot. 274 17th St is a home located in Kings County with nearby schools including Magnet School of Math Science & Design Technology, Hellenic Classical Charter School - Park Slope, and Al-Noor School.
Ownership History
Date
Name
Owned For
Owner Type
Purchase Details
Closed on
Nov 1, 2013
Sold by
Sebold Howard
Bought by
Sebold Howard and Sebold Shayna
Current Estimated Value
Home Financials for this Owner
Home Financials are based on the most recent Mortgage that was taken out on this home.
Original Mortgage
$500,000
Outstanding Balance
$373,170
Interest Rate
4.25%
Mortgage Type
New Conventional
Estimated Equity
$2,058,730
Purchase Details
Closed on
Sep 30, 2002
Sold by
Cordero Vismal
Bought by
Howard Sebold
Home Financials for this Owner
Home Financials are based on the most recent Mortgage that was taken out on this home.
Original Mortgage
$379,800
Interest Rate
6.04%
Purchase Details
Closed on
Jan 22, 1999
Sold by
Cordero Kerry Lee
Bought by
Cordero Vismal and Cordero Kerry Lee
Home Financials for this Owner
Home Financials are based on the most recent Mortgage that was taken out on this home.
Original Mortgage
$151,200
Interest Rate
7.02%
Create a Home Valuation Report for This Property
The Home Valuation Report is an in-depth analysis detailing your home's value as well as a comparison with similar homes in the area
Home Values in the Area
Average Home Value in this Area
Purchase History
| Date | Buyer | Sale Price | Title Company |
|---|---|---|---|
| Sebold Howard | -- | -- | |
| Howard Sebold | -- | -- | |
| Cordero Vismal | -- | Great Oak Title |
Source: Public Records
Mortgage History
| Date | Status | Borrower | Loan Amount |
|---|---|---|---|
| Open | Sebold Howard | $500,000 | |
| Previous Owner | Howard Sebold | $379,800 | |
| Previous Owner | Cordero Vismal | $151,200 |
Source: Public Records
Tax History
| Year | Tax Paid | Tax Assessment Tax Assessment Total Assessment is a certain percentage of the fair market value that is determined by local assessors to be the total taxable value of land and additions on the property. | Land | Improvement |
|---|---|---|---|---|
| 2025 | $7,121 | $163,380 | $18,360 | $145,020 |
| 2024 | $7,121 | $142,680 | $18,360 | $124,320 |
| 2023 | $6,981 | $171,240 | $18,360 | $152,880 |
| 2022 | $6,375 | $137,640 | $18,360 | $119,280 |
| 2021 | $6,524 | $110,880 | $18,360 | $92,520 |
| 2020 | $1,557 | $96,720 | $18,360 | $78,360 |
| 2019 | $3,080 | $106,980 | $18,360 | $88,620 |
| 2018 | $2,806 | $15,225 | $1,952 | $13,273 |
| 2017 | $2,634 | $14,389 | $2,910 | $11,479 |
| 2016 | $2,406 | $13,584 | $3,708 | $9,876 |
| 2015 | $1,417 | $13,584 | $4,862 | $8,722 |
| 2014 | $1,417 | $13,436 | $5,524 | $7,912 |
Source: Public Records
Map
Nearby Homes
- 247 18th St Unit 3
- 277 18th St
- 643 5th Ave Unit 6A
- 643 5th Ave Unit 6C
- 643 5th Ave Unit 3C
- 643 5th Ave Unit 5B
- 643 5th Ave Unit 4B
- 643 5th Ave Unit 5D
- 643 5th Ave Unit 6D
- 643 5th Ave Unit 3A
- 643 5th Ave Unit 3B
- 643 5th Ave Unit 2A
- 643 5th Ave Unit 1A
- 643 5th Ave Unit 5C
- 643 5th Ave Unit 4D
- 643 5th Ave Unit 2C
- 643 5th Ave Unit 5A
- 643 5th Ave Unit 4C
- 225 18th St
- 200 16th St Unit 3-A
Your Personal Tour Guide
Ask me questions while you tour the home.