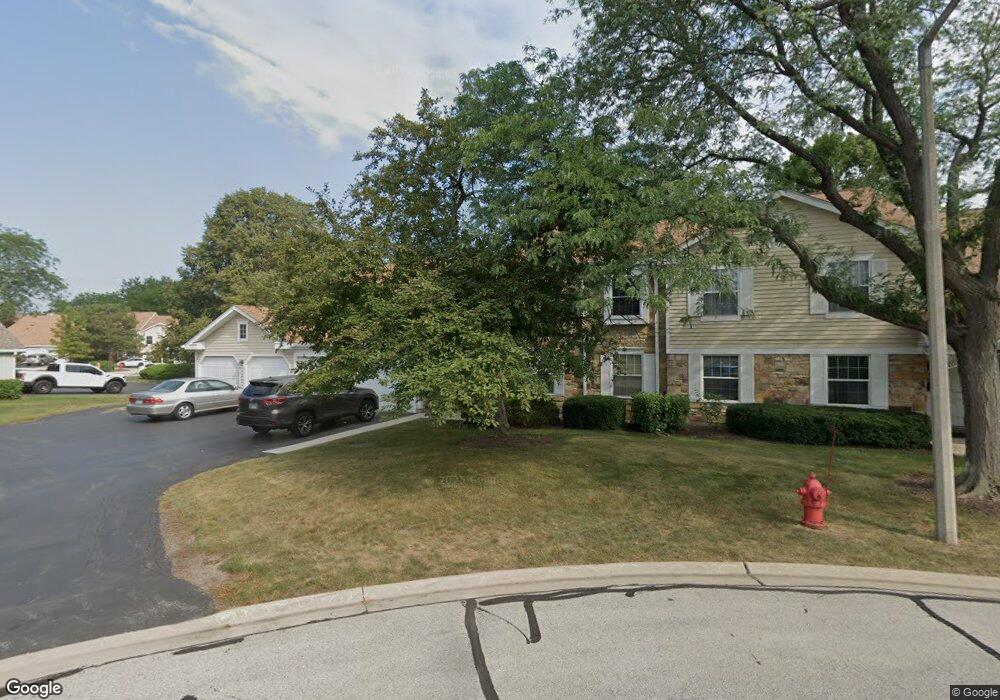
274 Appletree Ct Buffalo Grove, IL 60089
Estimated Value: $284,000 - $299,000
2
Beds
2
Baths
1,119
Sq Ft
$261/Sq Ft
Est. Value
About This Home
This home is located at 274 Appletree Ct, Buffalo Grove, IL 60089 and is currently estimated at $292,563, approximately $261 per square foot. 274 Appletree Ct is a home located in Lake County with nearby schools including Ivy Hall Elementary School, Twin Groves Middle School, and Adlai E Stevenson High School.
Ownership History
Date
Name
Owned For
Owner Type
Purchase Details
Closed on
Aug 6, 2015
Sold by
Gesior Carol M
Bought by
Kim Philip
Current Estimated Value
Home Financials for this Owner
Home Financials are based on the most recent Mortgage that was taken out on this home.
Original Mortgage
$170,000
Interest Rate
4.03%
Mortgage Type
VA
Purchase Details
Closed on
Jul 29, 2004
Sold by
Freitag Jill
Bought by
Gesior Carol M
Home Financials for this Owner
Home Financials are based on the most recent Mortgage that was taken out on this home.
Original Mortgage
$167,200
Interest Rate
6.1%
Mortgage Type
Unknown
Purchase Details
Closed on
Dec 10, 1998
Sold by
Chiaro John V and Chiaro Mary
Bought by
Freitag Jill
Home Financials for this Owner
Home Financials are based on the most recent Mortgage that was taken out on this home.
Original Mortgage
$126,500
Interest Rate
7.02%
Mortgage Type
FHA
Purchase Details
Closed on
Aug 27, 1997
Sold by
Chiaro John V
Bought by
Chiaro John V and Chiaro Mary
Create a Home Valuation Report for This Property
The Home Valuation Report is an in-depth analysis detailing your home's value as well as a comparison with similar homes in the area
Home Values in the Area
Average Home Value in this Area
Purchase History
| Date | Buyer | Sale Price | Title Company |
|---|---|---|---|
| Kim Philip | $170,000 | Attorney | |
| Gesior Carol M | $209,000 | Burnet Title Llc | |
| Freitag Jill | $131,000 | -- | |
| Chiaro John V | -- | -- |
Source: Public Records
Mortgage History
| Date | Status | Borrower | Loan Amount |
|---|---|---|---|
| Closed | Kim Philip | $170,000 | |
| Previous Owner | Gesior Carol M | $167,200 | |
| Previous Owner | Freitag Jill | $126,500 |
Source: Public Records
Tax History Compared to Growth
Tax History
| Year | Tax Paid | Tax Assessment Tax Assessment Total Assessment is a certain percentage of the fair market value that is determined by local assessors to be the total taxable value of land and additions on the property. | Land | Improvement |
|---|---|---|---|---|
| 2024 | $6,087 | $76,667 | $25,116 | $51,551 |
| 2023 | $5,810 | $72,341 | $23,699 | $48,642 |
| 2022 | $5,810 | $66,722 | $21,858 | $44,864 |
| 2021 | $5,581 | $66,002 | $21,622 | $44,380 |
| 2020 | $5,452 | $66,227 | $21,696 | $44,531 |
| 2019 | $5,867 | $65,983 | $21,616 | $44,367 |
| 2018 | $5,058 | $59,438 | $23,495 | $35,943 |
| 2017 | $4,958 | $58,051 | $22,947 | $35,104 |
| 2016 | $4,815 | $55,589 | $21,974 | $33,615 |
| 2015 | $5,273 | $51,986 | $20,550 | $31,436 |
| 2014 | $5,443 | $51,618 | $22,070 | $29,548 |
| 2012 | $5,136 | $51,721 | $22,114 | $29,607 |
Source: Public Records
Map
Nearby Homes
- 1112 Auburn Ln
- 746 Old Checker Rd Unit E5
- 728 Old Checker Rd Unit C4
- 620 Twisted Oak Ln
- 610 Maple Dr
- 412 Chateau Dr
- 760 Checker Dr
- 1545 Chickamauga Ln
- 630 Woodhollow Ln
- 810 Silver Rock Ln
- 1514 Sumter Dr
- 232 Manor Dr Unit 12C
- 12 Cloverdale Ct
- 1096 Beechwood Rd
- 1325 Fairfax Ln
- 25 Crestview Terrace
- 1117 Franklin Ln Unit C52
- 36 Crestview Terrace
- 612 White Pine Rd
- 4121 N Mallard Dr Unit 5
- 274 Appletree Ct Unit 274
- 278 Appletree Ct
- 272 Appletree Ct
- 246 Thornapple Ct
- 234 Thornapple Ct
- 208 Thornapple Ct
- 228 Thornapple Ct
- 226 Thornapple Ct
- 224 Thornapple Ct
- 222 Thornapple Ct Unit 2
- 248 Thornapple Ct
- 244 Thornapple Ct
- 242 Thornapple Ct
- 238 Thornapple Ct
- 236 Thornapple Ct
- 295 Ashland Ct
- 248 Thornapple Ct Unit 248
- 248 Thornapple Ct Unit 1-10-4
- 246 Thornapple Ct Unit 1-10-2
- 224 Thornapple Ct Unit 224