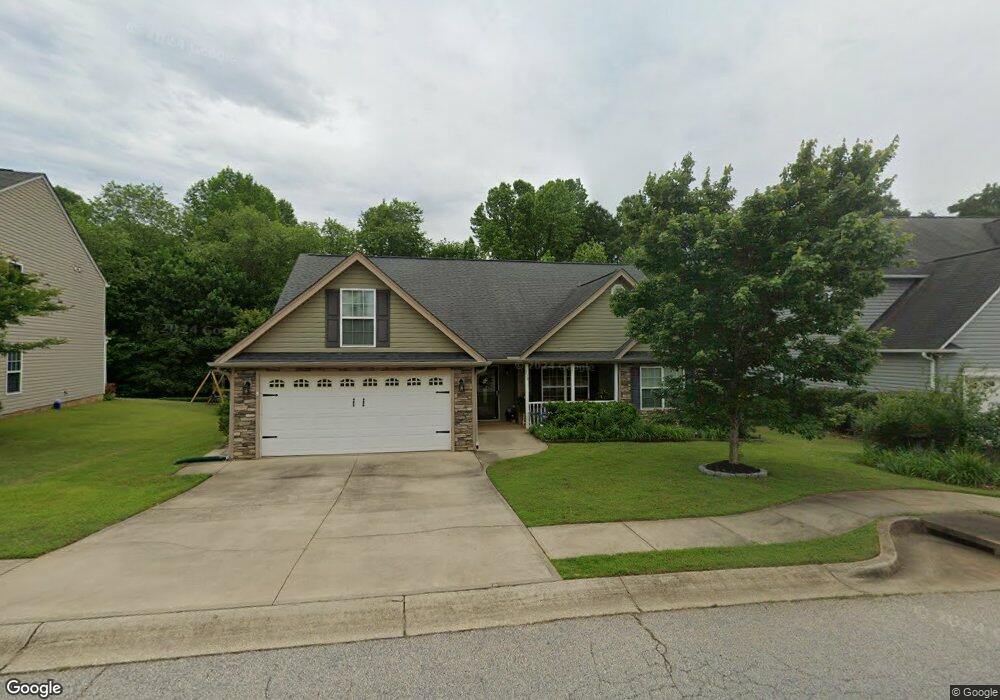
274 Bridgeport Rd Boiling Springs, SC 29316
Estimated Value: $300,349 - $317,000
3
Beds
2
Baths
1,675
Sq Ft
$186/Sq Ft
Est. Value
About This Home
This home is located at 274 Bridgeport Rd, Boiling Springs, SC 29316 and is currently estimated at $311,087, approximately $185 per square foot. 274 Bridgeport Rd is a home located in Spartanburg County with nearby schools including Boiling Springs Middle School, Boiling Springs High School, and Spartanburg Christian Academy.
Ownership History
Date
Name
Owned For
Owner Type
Purchase Details
Closed on
Apr 20, 2021
Sold by
Putnam Pamela J and Jones Pamela D
Bought by
Jones Pamela D
Current Estimated Value
Purchase Details
Closed on
Apr 9, 2012
Sold by
Harmon Lewis D and Harmon Nicole G
Bought by
Putnam Pamela J
Purchase Details
Closed on
May 14, 2010
Sold by
Enchanted Construction Llc
Bought by
Harmon Lewis D and Harmon Nicole G
Home Financials for this Owner
Home Financials are based on the most recent Mortgage that was taken out on this home.
Original Mortgage
$147,184
Interest Rate
5.5%
Mortgage Type
FHA
Purchase Details
Closed on
Apr 13, 2010
Sold by
Mark Iii Properties Inc
Bought by
Enchanted Construction Llc
Home Financials for this Owner
Home Financials are based on the most recent Mortgage that was taken out on this home.
Original Mortgage
$147,184
Interest Rate
5.5%
Mortgage Type
FHA
Create a Home Valuation Report for This Property
The Home Valuation Report is an in-depth analysis detailing your home's value as well as a comparison with similar homes in the area
Home Values in the Area
Average Home Value in this Area
Purchase History
| Date | Buyer | Sale Price | Title Company |
|---|---|---|---|
| Jones Pamela D | -- | None Available | |
| Putnam Pamela J | $149,900 | -- | |
| Harmon Lewis D | $149,900 | -- | |
| Enchanted Construction Llc | $29,000 | -- |
Source: Public Records
Mortgage History
| Date | Status | Borrower | Loan Amount |
|---|---|---|---|
| Previous Owner | Harmon Lewis D | $147,184 | |
| Previous Owner | Enchanted Construction Llc | $112,400 |
Source: Public Records
Tax History Compared to Growth
Tax History
| Year | Tax Paid | Tax Assessment Tax Assessment Total Assessment is a certain percentage of the fair market value that is determined by local assessors to be the total taxable value of land and additions on the property. | Land | Improvement |
|---|---|---|---|---|
| 2025 | $952 | $7,480 | $1,247 | $6,233 |
| 2024 | $952 | $7,480 | $1,247 | $6,233 |
| 2023 | $952 | $7,480 | $1,247 | $6,233 |
| 2022 | $1,134 | $6,504 | $1,125 | $5,379 |
| 2021 | $1,132 | $6,504 | $1,125 | $5,379 |
| 2020 | $1,115 | $6,504 | $1,125 | $5,379 |
| 2019 | $1,115 | $6,504 | $1,125 | $5,379 |
| 2018 | $1,089 | $6,504 | $1,125 | $5,379 |
| 2017 | $3,090 | $8,484 | $1,740 | $6,744 |
| 2016 | $967 | $5,656 | $1,160 | $4,496 |
| 2015 | $963 | $5,656 | $1,160 | $4,496 |
| 2014 | $950 | $5,656 | $1,160 | $4,496 |
Source: Public Records
Map
Nearby Homes
- 817 Culverhouse Rd
- 4614 Bessemer Ct
- 109 Dewfield Ln
- 636 Highgarden Ln
- 209 Stewarts Landing
- 544 Shoreline Blvd
- 845 Deepwood Ct
- 4322 Remington Ave
- 970 Deepwood Ct
- 921 Deepwood Ct
- 938 Deepwood Ct
- 413 Pierview Way
- 504 Witherspoon Ct
- 3075 Toliver Trail
- 166 Mistwood Ln
- 3059 Toliver Trail
- 7027 New Horizons Ln
- 806 Hartscove Ct
- 7031 New Horizons Ln
- 270 Bridgeport Rd
- 278 Bridgeport Rd
- 282 Bridgeport Rd
- 266 Bridgeport Rd
- 286 Bridgeport Rd
- 277 Bridgeport Rd
- 269 Bridgeport Rd
- 262 Bridgeport Rd
- 285 Bridgeport Rd
- 432 Shoreline Blvd
- 290 Bridgeport Rd
- 265 Bridgeport Rd
- 436 Shoreline Blvd
- 428 Shoreline Blvd
- 440 Shoreline Blvd
- 289 Bridgeport Rd
- 258 Bridgeport Rd
- 632 Cordelia Ct
- 294 Bridgeport Rd
- 624 Cordelia Ct