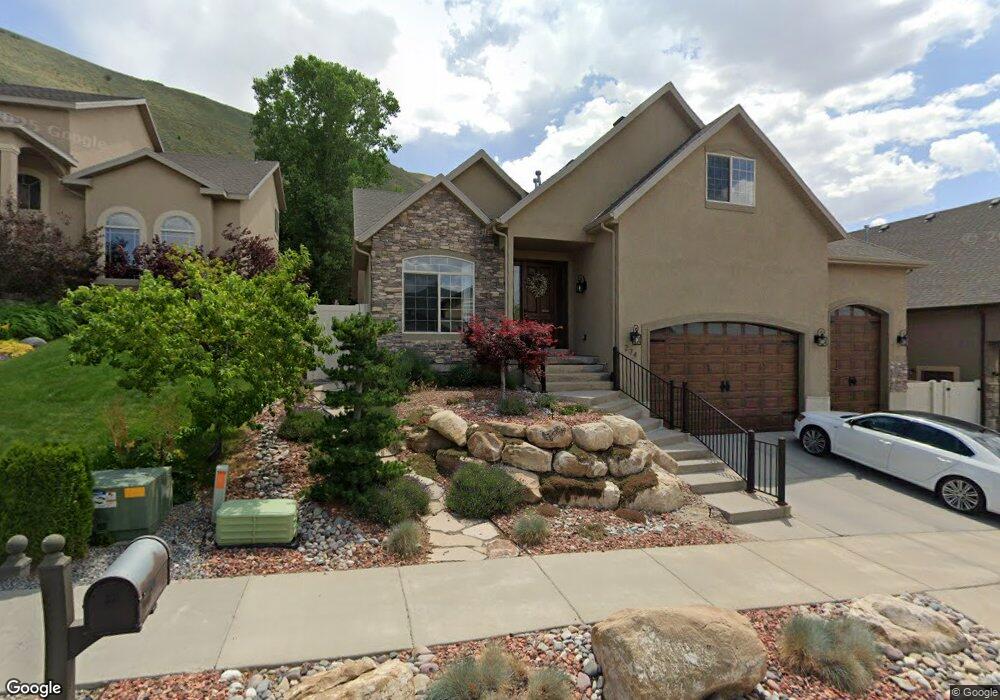
274 E Red Leaf Dr Draper, UT 84020
Estimated Value: $883,000 - $963,362
4
Beds
3
Baths
4,827
Sq Ft
$191/Sq Ft
Est. Value
About This Home
This home is located at 274 E Red Leaf Dr, Draper, UT 84020 and is currently estimated at $921,091, approximately $190 per square foot. 274 E Red Leaf Dr is a home located in Salt Lake County with nearby schools including Oak Hollow School, Draper Park Middle School, and Corner Canyon High School.
Ownership History
Date
Name
Owned For
Owner Type
Purchase Details
Closed on
Apr 2, 2018
Sold by
Beaulieu Roger A and Beaulieu Elizabeth
Bought by
Jensen Christopher P
Current Estimated Value
Home Financials for this Owner
Home Financials are based on the most recent Mortgage that was taken out on this home.
Original Mortgage
$464,977
Outstanding Balance
$399,500
Interest Rate
4.4%
Mortgage Type
New Conventional
Estimated Equity
$521,591
Purchase Details
Closed on
Dec 29, 2016
Sold by
Beaulieu Roger A
Bought by
Beaulieu Roger A and Beaulieu Elizabeth
Home Financials for this Owner
Home Financials are based on the most recent Mortgage that was taken out on this home.
Original Mortgage
$363,730
Interest Rate
4.03%
Mortgage Type
VA
Purchase Details
Closed on
Oct 11, 2012
Sold by
Vanwagoner Richard and Vanwagoner Debra A
Bought by
Beaulieu Roger A
Home Financials for this Owner
Home Financials are based on the most recent Mortgage that was taken out on this home.
Original Mortgage
$392,000
Interest Rate
3.58%
Mortgage Type
VA
Purchase Details
Closed on
Sep 30, 2008
Sold by
Heather Ridge Investments Llc
Bought by
Vanwagoner Richard B and Vanwagoner Debra A
Home Financials for this Owner
Home Financials are based on the most recent Mortgage that was taken out on this home.
Original Mortgage
$195,000
Interest Rate
6.43%
Mortgage Type
Purchase Money Mortgage
Purchase Details
Closed on
Jun 26, 2008
Sold by
Celtic Bank Corp
Bought by
Heather Ridge Investments Llc
Purchase Details
Closed on
Feb 27, 2008
Sold by
Ferrin Tamera
Bought by
Celtic Bank Corp
Purchase Details
Closed on
Dec 15, 2005
Sold by
Ferrin Craig E
Bought by
Ferrin Tamera
Home Financials for this Owner
Home Financials are based on the most recent Mortgage that was taken out on this home.
Original Mortgage
$404,089
Interest Rate
6.31%
Mortgage Type
Construction
Purchase Details
Closed on
Oct 17, 2005
Sold by
Jones Mark
Bought by
Ferrin Craig E
Home Financials for this Owner
Home Financials are based on the most recent Mortgage that was taken out on this home.
Original Mortgage
$404,089
Interest Rate
6.31%
Mortgage Type
Construction
Purchase Details
Closed on
Mar 14, 2005
Sold by
Highlands Llc
Bought by
Highlands At South Pointe Llc
Home Financials for this Owner
Home Financials are based on the most recent Mortgage that was taken out on this home.
Original Mortgage
$4,367,812
Interest Rate
5.61%
Mortgage Type
Purchase Money Mortgage
Create a Home Valuation Report for This Property
The Home Valuation Report is an in-depth analysis detailing your home's value as well as a comparison with similar homes in the area
Home Values in the Area
Average Home Value in this Area
Purchase History
| Date | Buyer | Sale Price | Title Company |
|---|---|---|---|
| Jensen Christopher P | -- | Monument Title Ins Co | |
| Beaulieu Roger A | -- | First American Title | |
| Beaulieu Roger A | -- | First American Title Co Llc | |
| Vanwagoner Richard B | -- | Security Title Ins Agency | |
| Heather Ridge Investments Llc | -- | Accommodation | |
| Celtic Bank Corp | $375,000 | Security Title Ins Agency | |
| Ferrin Tamera | -- | Meridian Title | |
| Ferrin Craig E | -- | Meridian Title | |
| Highlands At South Pointe Llc | -- | American Secure Title Sl |
Source: Public Records
Mortgage History
| Date | Status | Borrower | Loan Amount |
|---|---|---|---|
| Open | Jensen Christopher P | $464,977 | |
| Previous Owner | Beaulieu Roger A | $363,730 | |
| Previous Owner | Beaulieu Roger A | $392,000 | |
| Previous Owner | Vanwagoner Richard B | $195,000 | |
| Previous Owner | Ferrin Tamera | $404,089 | |
| Previous Owner | Highlands At South Pointe Llc | $4,367,812 |
Source: Public Records
Tax History
| Year | Tax Paid | Tax Assessment Tax Assessment Total Assessment is a certain percentage of the fair market value that is determined by local assessors to be the total taxable value of land and additions on the property. | Land | Improvement |
|---|---|---|---|---|
| 2025 | $4,218 | $849,300 | $201,500 | $647,800 |
| 2024 | $4,218 | $805,800 | $191,900 | $613,900 |
| 2023 | $3,423 | $649,100 | $170,700 | $478,400 |
| 2022 | $3,470 | $635,600 | $167,400 | $468,200 |
| 2021 | $3,580 | $560,100 | $127,500 | $432,600 |
| 2020 | $3,339 | $495,200 | $111,600 | $383,600 |
| 2019 | $3,529 | $511,400 | $108,400 | $403,000 |
| 2016 | $1,571 | $446,800 | $95,600 | $351,200 |
Source: Public Records
Map
Nearby Homes
- 14820 S Granite Ridge Ln
- 283 Nechatel Dr
- 14906 Treseder St
- 327 E Nechatel Dr
- 33 Ann Arbor Dr
- 102 E Manilla Dr
- 308 E Brayden Way
- 281 E Endurance Cir
- 283 E Endurance Cir
- 287 E Endurance Cir
- 14648 S Pristine View Cove
- 328 E Tri Ln
- 455 E Rocky Mouth Ln
- 14416 S Champ Cove
- 14414 S Champ Cove
- 14404 S Champ Cove
- 14396 S Champ Cove
- 14392 S Champ Cove
- 14374 S Champ Cove Unit 138
- 139 E Wayfield Dr
- 274 Red Leaf Dr
- 282 Red Leaf Dr
- 282 E Red Leaf Dr
- 266 E Red Leaf Dr
- 266 Red Leaf Dr
- 266 Red Leaf Dr Unit 72
- 275 Summer Leaf Dr
- 281 Summer Leaf Dr
- 281 E Summer Leaf Dr
- 267 Summer Leaf Dr
- 267 E Summer Leaf Dr
- 288 Red Leaf Dr
- 288 E Red Leaf Dr
- 258 Red Leaf Dr
- 258 Red Leaf Dr Unit 73
- 275 Red Leaf Dr
- 275 E Red Leaf Dr
- 267 E Red Leaf Dr
- 267 Red Leaf Dr
- 289 E Summer Leaf Dr