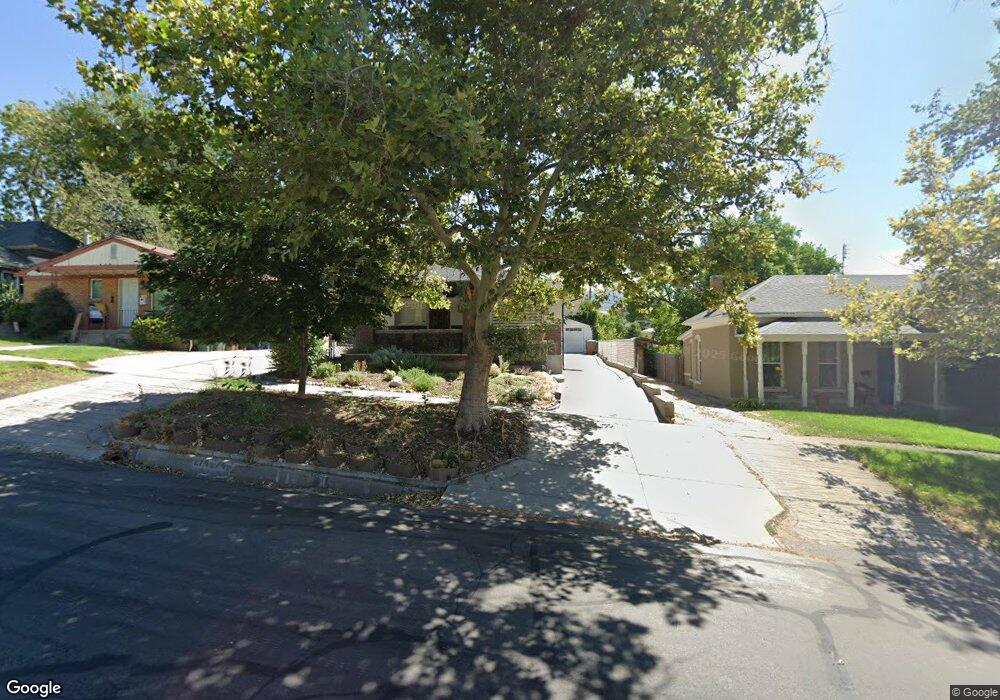
274 F St E Salt Lake City, UT 84103
The Avenues NeighborhoodEstimated Value: $695,000 - $852,255
3
Beds
3
Baths
1,900
Sq Ft
$408/Sq Ft
Est. Value
About This Home
This home is located at 274 F St E, Salt Lake City, UT 84103 and is currently estimated at $774,814, approximately $407 per square foot. 274 F St E is a home located in Salt Lake County with nearby schools including Ensign School, West High, and Open Classroom.
Ownership History
Date
Name
Owned For
Owner Type
Purchase Details
Closed on
Apr 18, 2023
Sold by
Ehmann Realty Llc
Bought by
Esfahani Sara and Behnam Yashar
Current Estimated Value
Home Financials for this Owner
Home Financials are based on the most recent Mortgage that was taken out on this home.
Original Mortgage
$431,000
Outstanding Balance
$418,686
Interest Rate
6.65%
Mortgage Type
New Conventional
Estimated Equity
$356,128
Purchase Details
Closed on
Jun 4, 2021
Sold by
Flores Christine
Bought by
Christine Flores Trust and Simper
Purchase Details
Closed on
Aug 12, 2008
Sold by
Flores Christine
Bought by
Flores Christine and The Christine Flores Trust
Create a Home Valuation Report for This Property
The Home Valuation Report is an in-depth analysis detailing your home's value as well as a comparison with similar homes in the area
Home Values in the Area
Average Home Value in this Area
Purchase History
| Date | Buyer | Sale Price | Title Company |
|---|---|---|---|
| Esfahani Sara | -- | Real Advantage Title Insurance | |
| Christine Flores Trust | -- | -- | |
| Flores Christine | -- | None Available |
Source: Public Records
Mortgage History
| Date | Status | Borrower | Loan Amount |
|---|---|---|---|
| Open | Esfahani Sara | $431,000 |
Source: Public Records
Tax History Compared to Growth
Tax History
| Year | Tax Paid | Tax Assessment Tax Assessment Total Assessment is a certain percentage of the fair market value that is determined by local assessors to be the total taxable value of land and additions on the property. | Land | Improvement |
|---|---|---|---|---|
| 2025 | $4,144 | $815,300 | $169,300 | $646,000 |
| 2024 | $4,144 | $790,700 | $161,600 | $629,100 |
| 2023 | $2,254 | $414,500 | $155,400 | $259,100 |
| 2022 | $2,335 | $402,900 | $152,400 | $250,500 |
| 2021 | $2,386 | $372,700 | $123,900 | $248,800 |
| 2020 | $794 | $347,800 | $117,700 | $230,100 |
| 2019 | $2,271 | $317,700 | $104,500 | $213,200 |
| 2018 | $0 | $301,500 | $104,500 | $197,000 |
| 2017 | $1,029 | $289,700 | $104,500 | $185,200 |
| 2016 | $1,009 | $270,400 | $99,800 | $170,600 |
| 2015 | $1,028 | $259,400 | $94,300 | $165,100 |
| 2014 | $914 | $256,500 | $100,700 | $155,800 |
Source: Public Records
Map
Nearby Homes