Estimated Value: $352,000 - $384,635
4
Beds
3
Baths
2,502
Sq Ft
$147/Sq Ft
Est. Value
About This Home
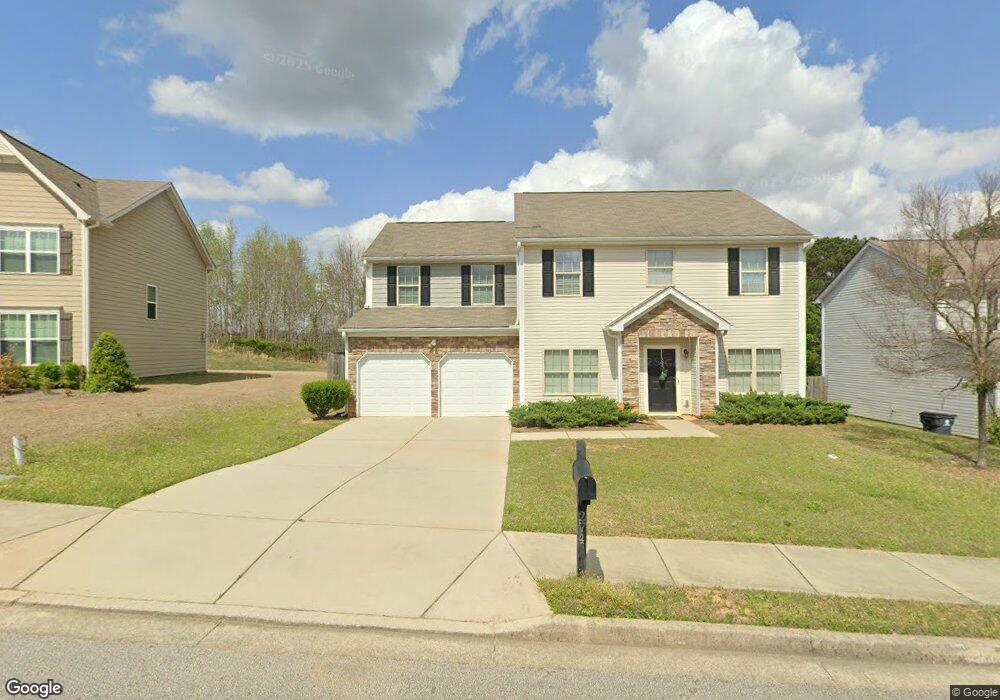
This home is located at 274 Lanier Ct, Hiram, GA 30141 and is currently estimated at $367,659, approximately $146 per square foot. 274 Lanier Ct is a home with nearby schools including Hiram Elementary School, P. B. Ritch Middle School, and Hiram High School.
Ownership History
Date
Name
Owned For
Owner Type
Purchase Details
Closed on
Jan 26, 2015
Sold by
Paxis Grp Llc
Bought by
American Residential Leasing C
Current Estimated Value
Purchase Details
Closed on
May 21, 2014
Sold by
Trustee Management Svcs Inc Tr
Bought by
Paxis Grp Llc
Purchase Details
Closed on
Mar 4, 2013
Sold by
Ri Waterman Properties Inc
Bought by
Trustee Management Svcs Inc Tr and Regency Lot Trust
Purchase Details
Closed on
Feb 3, 2009
Sold by
Pine Grove Builders Inc
Bought by
Ri Waterman Properties Inc
Purchase Details
Closed on
Feb 12, 2007
Sold by
Wilson Land & Dev Corp
Bought by
Winstar Dev Inc
Home Financials for this Owner
Home Financials are based on the most recent Mortgage that was taken out on this home.
Original Mortgage
$1,474,650
Interest Rate
6.17%
Create a Home Valuation Report for This Property
The Home Valuation Report is an in-depth analysis detailing your home's value as well as a comparison with similar homes in the area
Home Values in the Area
Average Home Value in this Area
Purchase History
| Date | Buyer | Sale Price | Title Company |
|---|---|---|---|
| American Residential Leasing C | $157,184 | -- | |
| Paxis Grp Llc | $780,052 | -- | |
| Trustee Management Svcs Inc Tr | $112,000 | -- | |
| Ri Waterman Properties Inc | $730,000 | -- | |
| Winstar Dev Inc | $3,828,000 | -- |
Source: Public Records
Mortgage History
| Date | Status | Borrower | Loan Amount |
|---|---|---|---|
| Previous Owner | Winstar Dev Inc | $1,474,650 |
Source: Public Records
Tax History Compared to Growth
Tax History
| Year | Tax Paid | Tax Assessment Tax Assessment Total Assessment is a certain percentage of the fair market value that is determined by local assessors to be the total taxable value of land and additions on the property. | Land | Improvement |
|---|---|---|---|---|
| 2024 | $3,731 | $149,996 | $12,328 | $137,668 |
| 2023 | $3,910 | $149,996 | $16,000 | $133,996 |
| 2022 | $2,229 | $85,516 | $12,000 | $73,516 |
| 2021 | $2,485 | $85,516 | $12,000 | $73,516 |
| 2020 | $2,540 | $85,516 | $12,000 | $73,516 |
| 2019 | $2,571 | $85,344 | $12,000 | $73,344 |
| 2018 | $2,142 | $71,084 | $8,000 | $63,084 |
| 2017 | $1,810 | $59,248 | $8,000 | $51,248 |
| 2016 | $1,857 | $61,424 | $8,000 | $53,424 |
| 2015 | $1,896 | $61,596 | $8,000 | $53,596 |
| 2014 | $40 | $1,280 | $1,280 | $0 |
| 2013 | -- | $1,280 | $1,280 | $0 |
Source: Public Records
Map
Nearby Homes
- 322 Lanier Ct
- 79 Kennedy Ct
- 143 Birch St
- 273 Baywood Crossing
- 98 Baywood Way
- 2393 Bill Carruth Pkwy
- 133 Willow Bend Dr
- 149 Willow Bend Dr
- 3124 Hiram Sudie Rd
- 133 Willow Bend Rd
- 149 Willow Bend Rd
- 14 Berkten Ct
- 552 Rich Davis Rd
- 7606 Nebo Rd
- 96 Quail Bend Way
- 261 Township Dr
- 9 Darbys Run Way
- 24 Darbys Run Way
- 7799 Nebo Rd
- 25 Derby Dr
- 262 Lanier Ct
- 288 Lanier Ct
- 248 Lanier Ct
- 265 Lenore Ct
- 300 Lanier Ct
- 271 Lanier Ct
- 293 Lanier Ct
- 238 Lanier Ct
- 312 Lanier Ct Unit 110
- 312 Lanier Ct
- 305 Lanier Ct Unit 198
- 305 Lanier Ct
- 38 Monarch Way
- 60 Monarch Way
- 72 Monarch Way
- 319 Lanier Ct Unit 197
- 319 Lanier Ct
- 322 Lanier Ct Unit 109
- 88 Monarch Way
- 224 Lanier Ct Unit 117