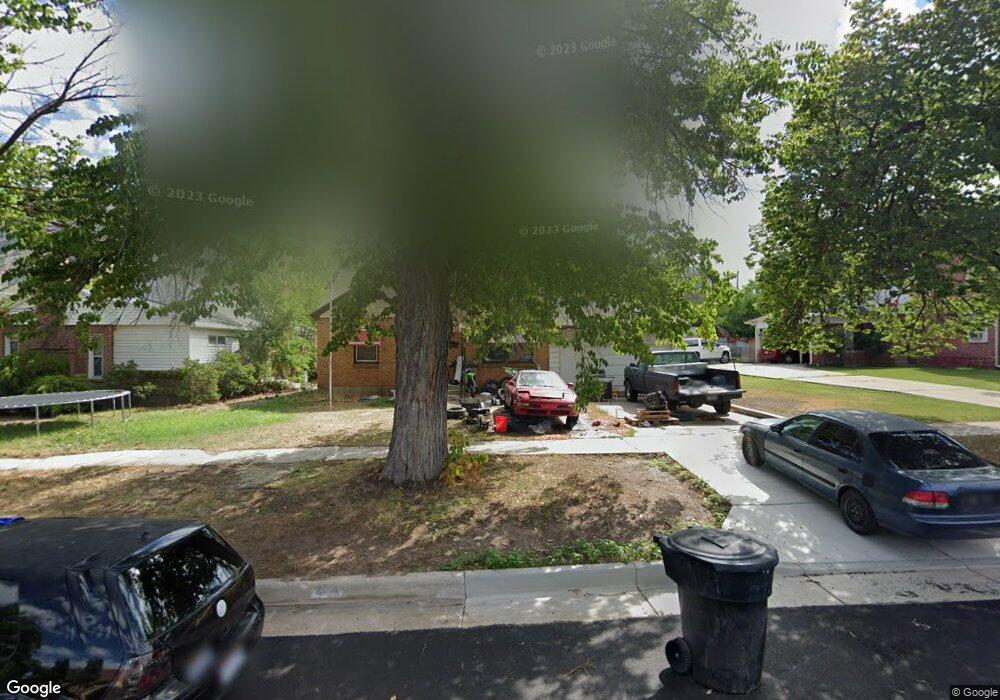
274 N 100 E Brigham City, UT 84302
Estimated Value: $345,431 - $356,000
3
Beds
2
Baths
1,697
Sq Ft
$207/Sq Ft
Est. Value
About This Home
This home is located at 274 N 100 E, Brigham City, UT 84302 and is currently estimated at $351,358, approximately $207 per square foot. 274 N 100 E is a home located in Box Elder County with nearby schools including Box Elder Middle School, Adele C. Young Intermediate School, and Box Elder High School.
Ownership History
Date
Name
Owned For
Owner Type
Purchase Details
Closed on
Jul 21, 2016
Sold by
Witt April M and Sidwell Jeffery L
Bought by
Sidwell Jeffery L and Sidwell April M
Current Estimated Value
Home Financials for this Owner
Home Financials are based on the most recent Mortgage that was taken out on this home.
Original Mortgage
$98,250
Interest Rate
3.54%
Mortgage Type
New Conventional
Create a Home Valuation Report for This Property
The Home Valuation Report is an in-depth analysis detailing your home's value as well as a comparison with similar homes in the area
Home Values in the Area
Average Home Value in this Area
Purchase History
| Date | Buyer | Sale Price | Title Company |
|---|---|---|---|
| Sidwell Jeffery L | -- | Mountain View Stitle Ogden |
Source: Public Records
Mortgage History
| Date | Status | Borrower | Loan Amount |
|---|---|---|---|
| Closed | Sidwell Jeffery L | $98,250 |
Source: Public Records
Tax History Compared to Growth
Tax History
| Year | Tax Paid | Tax Assessment Tax Assessment Total Assessment is a certain percentage of the fair market value that is determined by local assessors to be the total taxable value of land and additions on the property. | Land | Improvement |
|---|---|---|---|---|
| 2025 | $1,659 | $326,726 | $103,750 | $222,976 |
| 2024 | $1,659 | $319,459 | $98,750 | $220,709 |
| 2023 | $1,654 | $326,075 | $93,750 | $232,325 |
| 2022 | $1,690 | $309,745 | $40,000 | $269,745 |
| 2021 | $1,272 | $181,730 | $40,000 | $141,730 |
| 2020 | $1,119 | $181,730 | $40,000 | $141,730 |
| 2019 | $1,052 | $90,984 | $22,000 | $68,984 |
| 2018 | $954 | $81,986 | $22,000 | $59,986 |
| 2017 | $766 | $114,000 | $16,500 | $84,000 |
| 2016 | $804 | $60,500 | $16,500 | $44,000 |
| 2015 | $753 | $56,500 | $16,500 | $40,000 |
| 2014 | $753 | $54,595 | $16,500 | $38,095 |
| 2013 | -- | $54,595 | $16,500 | $38,095 |
Source: Public Records
Map
Nearby Homes