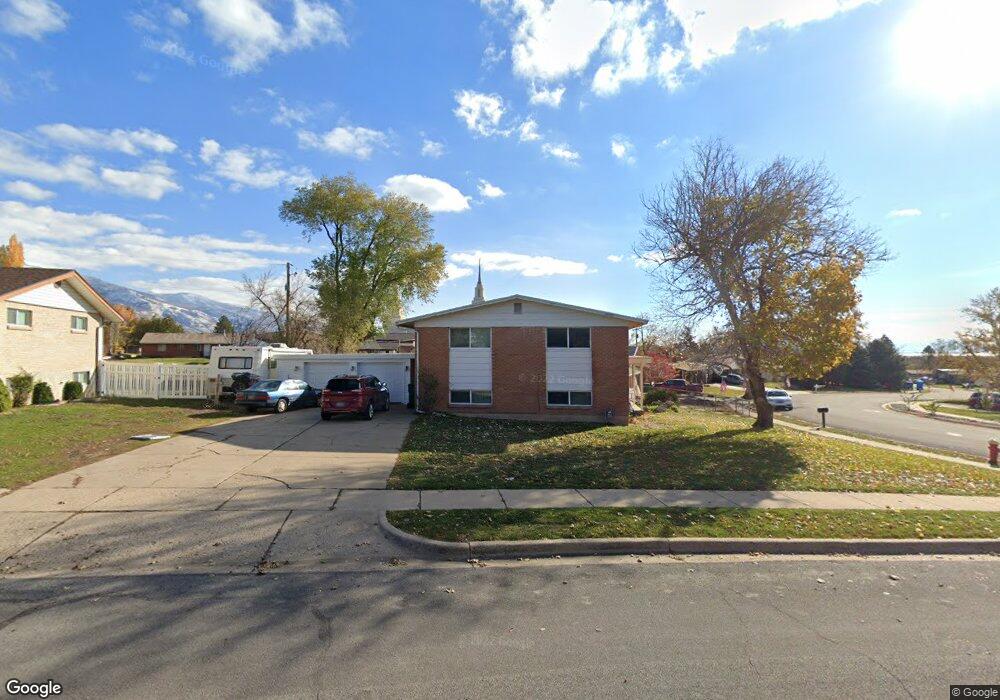
274 N Eastcrest Dr Layton, UT 84040
Estimated Value: $460,000 - $512,000
4
Beds
2
Baths
1,131
Sq Ft
$426/Sq Ft
Est. Value
About This Home
This home is located at 274 N Eastcrest Dr, Layton, UT 84040 and is currently estimated at $482,069, approximately $426 per square foot. 274 N Eastcrest Dr is a home located in Davis County with nearby schools including Whitesides Elementary School, Central Davis Junior High School, and Layton High School.
Ownership History
Date
Name
Owned For
Owner Type
Purchase Details
Closed on
Mar 16, 2002
Sold by
Roper Betty A
Bought by
Cloyd Lisa C
Current Estimated Value
Home Financials for this Owner
Home Financials are based on the most recent Mortgage that was taken out on this home.
Original Mortgage
$121,099
Outstanding Balance
$49,329
Interest Rate
6.85%
Mortgage Type
FHA
Estimated Equity
$432,740
Purchase Details
Closed on
Feb 12, 2001
Sold by
Roper Simpson J and Roper Betty A
Bought by
Roper Simpson J and Roper Betty A
Purchase Details
Closed on
Jul 14, 1998
Sold by
Roper Simpson Jay and Roper Betty A
Bought by
Roper Simpson J and Roper Betty A
Purchase Details
Closed on
May 13, 1996
Sold by
Sourthridge Development Corp
Bought by
Murri Marvin R and Murri Tamara B
Create a Home Valuation Report for This Property
The Home Valuation Report is an in-depth analysis detailing your home's value as well as a comparison with similar homes in the area
Home Values in the Area
Average Home Value in this Area
Purchase History
| Date | Buyer | Sale Price | Title Company |
|---|---|---|---|
| Cloyd Lisa C | -- | Founders Title Co | |
| Roper Simpson J | -- | -- | |
| Roper Simpson J | -- | -- | |
| Murri Marvin R | -- | Bonneville Title Company Inc |
Source: Public Records
Mortgage History
| Date | Status | Borrower | Loan Amount |
|---|---|---|---|
| Open | Cloyd Lisa C | $121,099 |
Source: Public Records
Tax History Compared to Growth
Tax History
| Year | Tax Paid | Tax Assessment Tax Assessment Total Assessment is a certain percentage of the fair market value that is determined by local assessors to be the total taxable value of land and additions on the property. | Land | Improvement |
|---|---|---|---|---|
| 2025 | $2,175 | $228,250 | $122,741 | $105,509 |
| 2024 | $2,081 | $220,000 | $144,587 | $75,413 |
| 2023 | $2,023 | $377,000 | $193,249 | $183,751 |
| 2022 | $2,119 | $214,500 | $103,807 | $110,693 |
| 2021 | $2,054 | $310,000 | $158,223 | $151,777 |
| 2020 | $1,657 | $240,000 | $129,065 | $110,935 |
| 2019 | $1,636 | $232,000 | $115,089 | $116,911 |
| 2018 | $1,489 | $212,000 | $90,332 | $121,668 |
| 2016 | $1,352 | $99,330 | $47,390 | $51,940 |
| 2015 | $1,328 | $92,620 | $47,390 | $45,230 |
| 2014 | $1,110 | $79,175 | $47,390 | $31,785 |
| 2013 | -- | $88,814 | $22,748 | $66,066 |
Source: Public Records
Map
Nearby Homes
- 1515 E Gentile St
- 1247 E 300 N
- 479 N 1375 E
- 1503 E 530 N
- 431 N 1050 E
- 580 N Allanwood Place
- 308 N 1800 E
- 1168 Holmes Creek Ln
- 508 N Adamswood Rd
- 942 E Gentile St
- 556 N Fairfield Rd Unit A2
- 556 N Fairfield Rd Unit D1
- 556 N Fairfield Rd Unit D2
- 556 N Fairfield Rd Unit A3
- 556 N Fairfield Rd Unit D3
- 556 N Fairfield Rd Unit D4
- 556 N Fairfield Rd Unit A1
- 556 N Fairfield Rd Unit A4
- 861 E 575 N
- 857 E 575 N
- 274 N 1350 E
- 1414 E 275 N
- 270 N Eastcrest Dr
- 268 N Eastcrest Dr
- 1348 E 275 N
- 1418 E 275 N
- 1407 E 275 N
- 1417 E 275 N
- 1349 E 275 N
- 1455 E Gentile St
- 267 N Eastcrest Dr
- 1433 E Gentile St
- 1419 E 275 N
- 250 N Eastcrest Dr
- 1425 E Gentile St
- 1461 E Gentile St
- 1345 E 275 N
- 1422 E 275 N
- 1417 E Gentile St
- 277 Betty Lynn St