
274 Park St Bridgeport, CT 06608
East Side Bridgeport NeighborhoodEstimated payment $3,635/month
Highlights
- Attic
- Hot Water Circulator
- Hot Water Heating System
About This Home
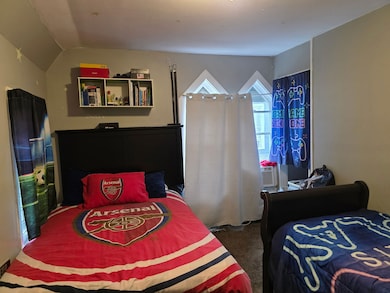
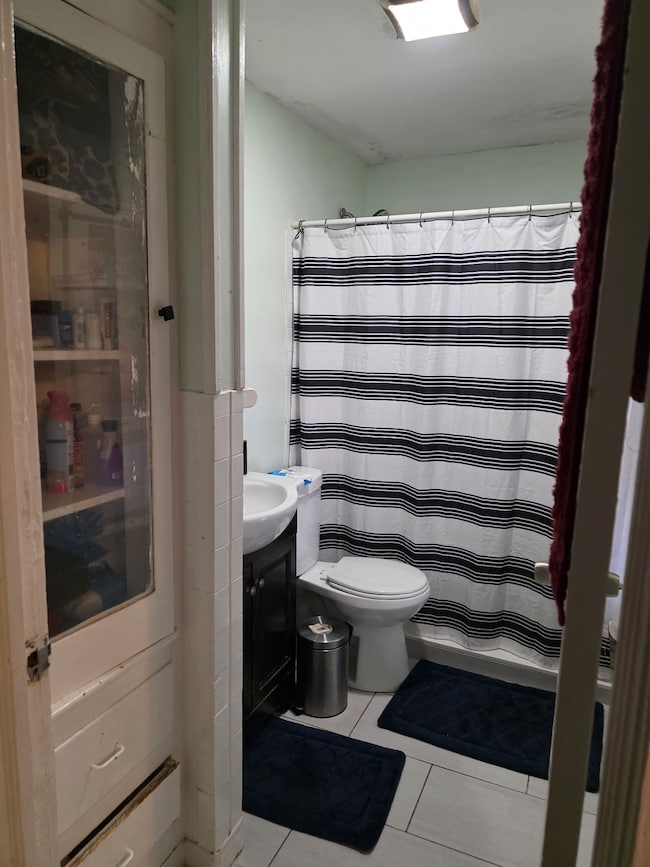
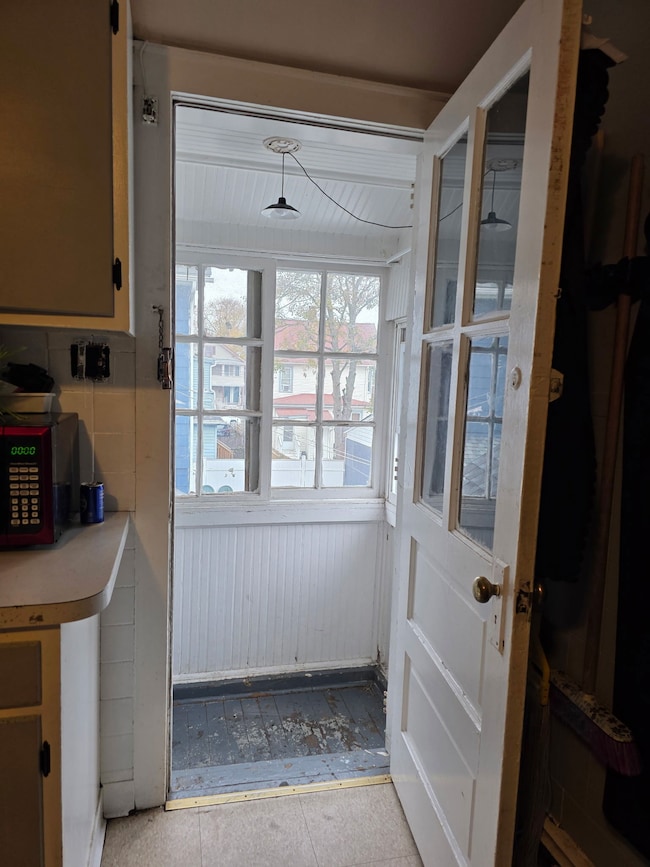
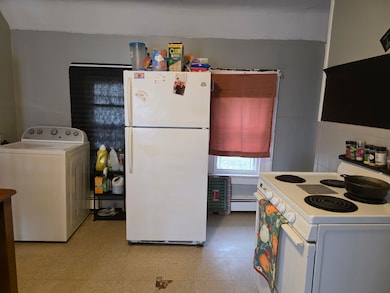
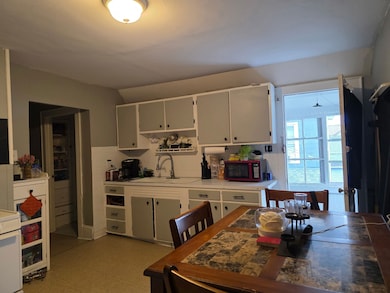
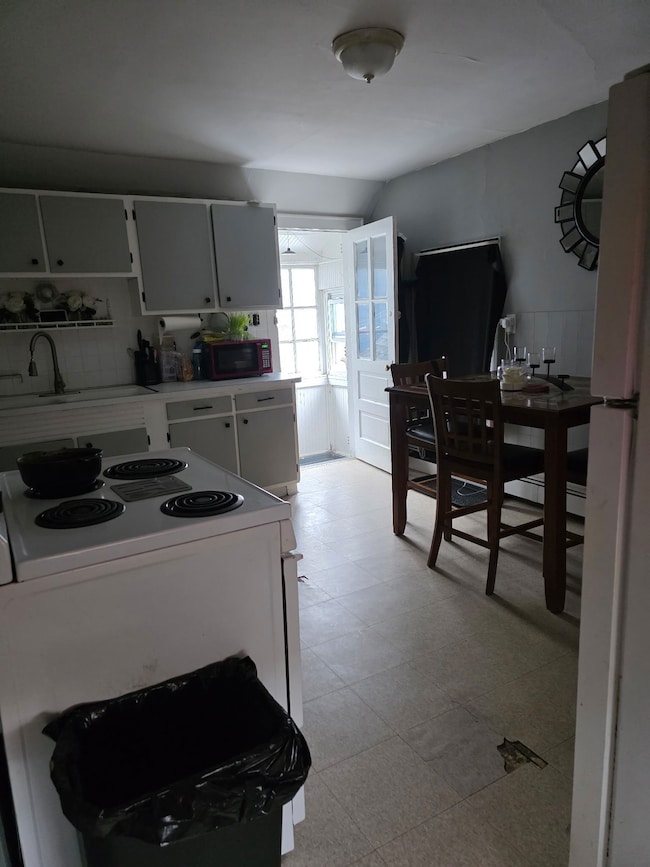
A well-maintained two-family residence offering great investment potential or the perfect opportunity for owner-occupancy. Each unit features 2 spacious bedrooms and 1 full bathroom, providing comfortable and functional living spaces. Both apartments boast bright living rooms, eat-in kitchens, and ample closet space. The property includes separate utilities for each unit, making management simple and efficient. The home also features a private backyard ideal for outdoor gatherings and off-street parking for convenience. Located in a quiet and accessible neighborhood, this property is close to local schools, shopping centers, public transportation, and major highways, making it an excellent choice for tenants or homeowners alike. There is a bathroom in the basement.
Listing Agent
Jordan Realty Co. Brokerage Phone: (203) 696-0337 License #REB.0791102 Listed on: 11/13/2025
Property Details
Home Type
- Multi-Family
Est. Annual Taxes
- $7,265
Year Built
- Built in 1887
Lot Details
- 4,792 Sq Ft Lot
Home Design
- Concrete Foundation
- Asphalt Shingled Roof
- Concrete Siding
- Shingle Siding
Interior Spaces
- 3,097 Sq Ft Home
- Finished Basement
- Basement Fills Entire Space Under The House
Bedrooms and Bathrooms
- 4 Bedrooms
- 2 Full Bathrooms
Attic
- Storage In Attic
- Walkup Attic
Parking
- 3 Car Garage
- Driveway
Utilities
- Hot Water Heating System
- Heating System Uses Oil
- Hot Water Circulator
- Oil Water Heater
- Fuel Tank Located in Basement
Community Details
- 2 Units
Listing and Financial Details
- Assessor Parcel Number 24185
Map
Home Values in the Area
Average Home Value in this Area
Tax History
| Year | Tax Paid | Tax Assessment Tax Assessment Total Assessment is a certain percentage of the fair market value that is determined by local assessors to be the total taxable value of land and additions on the property. | Land | Improvement |
|---|---|---|---|---|
| 2025 | $7,265 | $167,210 | $41,160 | $126,050 |
| 2024 | $7,265 | $167,210 | $41,160 | $126,050 |
| 2023 | $7,265 | $167,210 | $41,160 | $126,050 |
| 2022 | $7,265 | $167,210 | $41,160 | $126,050 |
| 2021 | $7,265 | $167,210 | $41,160 | $126,050 |
| 2020 | $6,648 | $123,130 | $17,540 | $105,590 |
| 2019 | $6,648 | $123,130 | $17,540 | $105,590 |
| 2018 | $6,695 | $123,130 | $17,540 | $105,590 |
| 2017 | $6,695 | $123,130 | $17,540 | $105,590 |
| 2016 | $6,695 | $123,130 | $17,540 | $105,590 |
| 2015 | $7,225 | $171,200 | $30,650 | $140,550 |
| 2014 | $7,225 | $171,200 | $30,650 | $140,550 |
Property History
| Date | Event | Price | List to Sale | Price per Sq Ft |
|---|---|---|---|---|
| 11/13/2025 11/13/25 | For Sale | $575,000 | -- | $186 / Sq Ft |
Purchase History
| Date | Type | Sale Price | Title Company |
|---|---|---|---|
| Warranty Deed | $282,000 | -- | |
| Warranty Deed | $282,000 | -- | |
| Warranty Deed | $190,000 | -- | |
| Warranty Deed | $190,000 | -- | |
| Warranty Deed | $140,000 | -- | |
| Warranty Deed | $140,000 | -- | |
| Warranty Deed | $130,000 | -- | |
| Warranty Deed | $130,000 | -- | |
| Deed | $125,000 | -- |
Mortgage History
| Date | Status | Loan Amount | Loan Type |
|---|---|---|---|
| Open | $279,784 | No Value Available | |
| Closed | $279,784 | Purchase Money Mortgage | |
| Previous Owner | $142,500 | No Value Available |
Source: SmartMLS
MLS Number: 24139729
APN: BRID-001623-000005
Disclaimer: Certain information contained herein is derived from information provided by parties other than Homes.com. All information provided is deemed reliable, but is not guaranteed to be accurate and should be independently verified.
![]() IDX information is provided exclusively for personal, non-commercial use, and may not be used for any purpose other than to identify prospective properties consumers may be interested in purchasing. Information is deemed reliable but not guaranteed.
IDX information is provided exclusively for personal, non-commercial use, and may not be used for any purpose other than to identify prospective properties consumers may be interested in purchasing. Information is deemed reliable but not guaranteed.
- 237 Park St Unit 2
- 237 Park St Unit 2nd Floor
- 235 Park St Unit 2
- 245 Jane St
- 245 Jane St
- 26 Pleasant St Unit 1st floor
- 857 Noble Ave Unit 1
- 1057 E Main St
- 1057 E Main St Unit 1
- 642 William St Unit 2
- 388 William St Unit A
- 388 William St Unit B
- 519 Brooks St
- 519 Brooks St Unit 519 Brooks St.
- 272 William St Unit 3
- 240 William St Unit 2A
- 1220 Pembroke St Unit 3L
- 1220 Pembroke St Unit 3R
- 1220 Pembroke St
- 1055 Pembroke St
