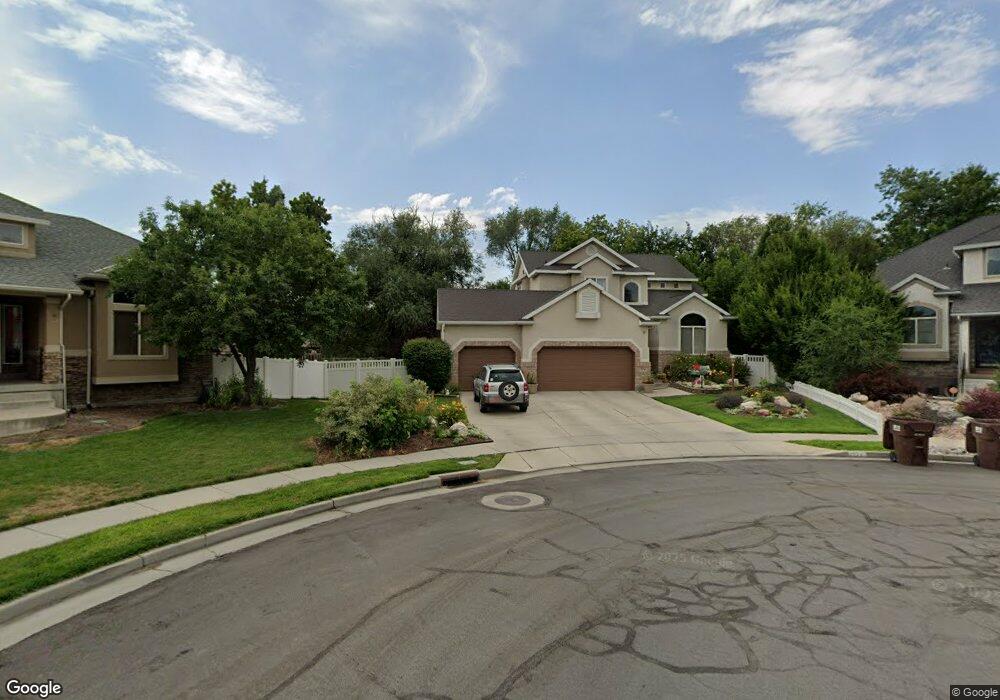
274 Regent Park Ct Midvale, UT 84047
Estimated Value: $624,000 - $679,000
4
Beds
3
Baths
1,957
Sq Ft
$335/Sq Ft
Est. Value
About This Home
This home is located at 274 Regent Park Ct, Midvale, UT 84047 and is currently estimated at $654,662, approximately $334 per square foot. 274 Regent Park Ct is a home located in Salt Lake County with nearby schools including Midvalley Elementary School, Hillcrest High School, and Union Middle School.
Ownership History
Date
Name
Owned For
Owner Type
Purchase Details
Closed on
Sep 22, 2000
Sold by
Ivory Homes Ltd
Bought by
Schersligt Rhet A and Scherligt Michelle T
Current Estimated Value
Home Financials for this Owner
Home Financials are based on the most recent Mortgage that was taken out on this home.
Original Mortgage
$241,100
Outstanding Balance
$87,686
Interest Rate
8.07%
Estimated Equity
$566,976
Create a Home Valuation Report for This Property
The Home Valuation Report is an in-depth analysis detailing your home's value as well as a comparison with similar homes in the area
Home Values in the Area
Average Home Value in this Area
Purchase History
| Date | Buyer | Sale Price | Title Company |
|---|---|---|---|
| Schersligt Rhet A | -- | Guardian Title |
Source: Public Records
Mortgage History
| Date | Status | Borrower | Loan Amount |
|---|---|---|---|
| Open | Schersligt Rhet A | $241,100 |
Source: Public Records
Tax History Compared to Growth
Tax History
| Year | Tax Paid | Tax Assessment Tax Assessment Total Assessment is a certain percentage of the fair market value that is determined by local assessors to be the total taxable value of land and additions on the property. | Land | Improvement |
|---|---|---|---|---|
| 2025 | $3,941 | $644,600 | $187,700 | $456,900 |
| 2024 | $3,941 | $647,000 | $170,700 | $476,300 |
| 2023 | $3,578 | $582,100 | $162,200 | $419,900 |
| 2022 | $4,142 | $595,800 | $159,000 | $436,800 |
| 2021 | $3,263 | $443,400 | $150,500 | $292,900 |
| 2020 | $3,085 | $396,700 | $131,400 | $265,300 |
| 2019 | $3,188 | $399,400 | $124,000 | $275,400 |
| 2016 | $2,977 | $351,500 | $124,000 | $227,500 |
Source: Public Records
Map
Nearby Homes
- 7359 S Dewmar Ct W Unit 32
- 7352 S Dewmar Ct W Unit 43
- 7360 S Dewmar Ct W Unit 41
- 7363 S Dewmar Ct W Unit 33
- 7342 S Seven Tree Ln W Unit 77
- 7329 S Seven Tree Ln W Unit 85
- 7371 S Dewmar Ct W Unit 35
- 7327 S Seven Tree Ln W Unit 86
- 7376 S Dewmar Ct W Unit 37
- 7337 S Seven Tree Ln W Unit 82
- 7372 S Dewmar Ct W Unit 38
- 7343 S Seven Tree Ln Unit 79
- 7355 S Dewmar Ct W Unit 31
- 7356 S Dewmar Ct W Unit 42
- 7368 S Dewmar Ct W Unit 39
- 7364 S Dewmar Ct W Unit 40
- 218 E 7615 S
- 210 Greenwood Ave Unit 102
- 7479 S Randall Cir
- 133 E 7615 S
- 278 E Regent Park Ct
- 271 Regent Park Ct
- 271 E Regent Park Ct
- 278 Regent Park Ct
- 284 E Regent Park Ct
- 275 E Regent Park Ct
- 275 Regent Park Ct
- 284 Regent Park Ct
- 281 Regent Park Ct
- 290 E Regent Park Ct
- 287 Regent Park Ct
- 239 E 7615 S
- 7616 S 300 E
- 274 E Regent Hill Cir
- 274 Regent Hill Cir
- 284 E Regent Hill Cir
- 284 Regent Hill Cir
- 7626 S 300 E
- 293 E Regent Park Ct
- 293 Regent Park Ct