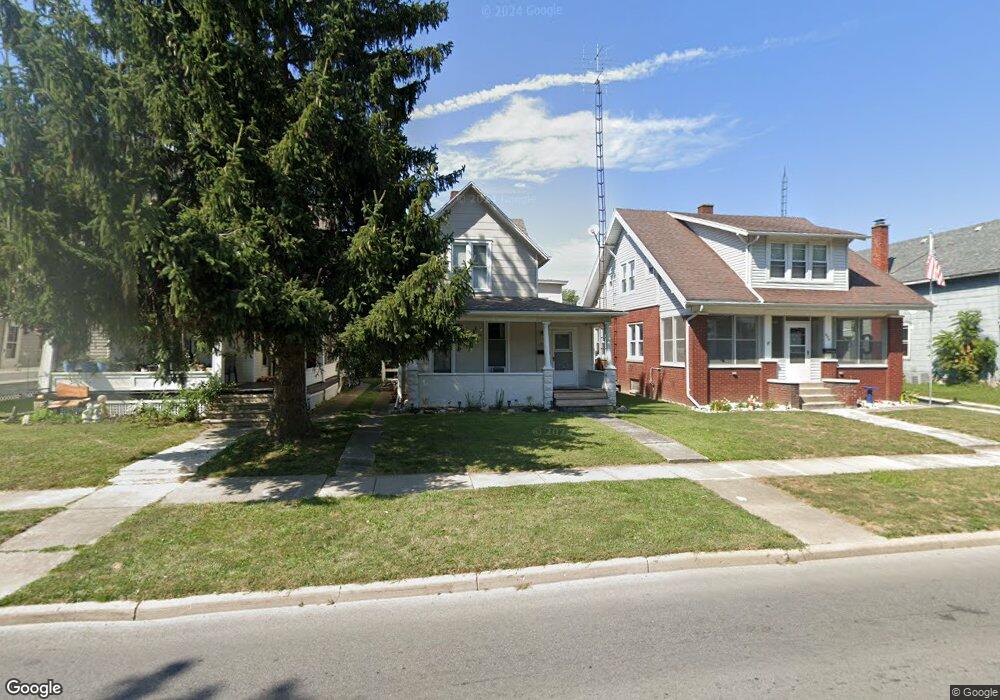
274 W Perry St Tiffin, OH 44883
Estimated Value: $117,000 - $127,000
3
Beds
2
Baths
1,989
Sq Ft
$62/Sq Ft
Est. Value
About This Home
This home is located at 274 W Perry St, Tiffin, OH 44883 and is currently estimated at $123,166, approximately $61 per square foot. 274 W Perry St is a home located in Seneca County with nearby schools including Columbian High School, Calvert Catholic Elementary School, and Calvert High School.
Ownership History
Date
Name
Owned For
Owner Type
Purchase Details
Closed on
Nov 28, 2007
Sold by
Harrington Of Sycamore Ltd
Bought by
Burwell Michael
Current Estimated Value
Home Financials for this Owner
Home Financials are based on the most recent Mortgage that was taken out on this home.
Original Mortgage
$62,605
Outstanding Balance
$39,647
Interest Rate
6.31%
Mortgage Type
New Conventional
Estimated Equity
$83,519
Purchase Details
Closed on
Jan 4, 2001
Bought by
Harrington Of Sycamore Ltd
Purchase Details
Closed on
May 11, 1999
Sold by
Martien Debra S
Bought by
Schalk Properties Ltd
Purchase Details
Closed on
Apr 29, 1996
Sold by
Martien Debra S
Bought by
Martien Debra S
Purchase Details
Closed on
Mar 4, 1994
Sold by
Martien Michael D
Bought by
Martien Debra S
Purchase Details
Closed on
Mar 1, 1987
Create a Home Valuation Report for This Property
The Home Valuation Report is an in-depth analysis detailing your home's value as well as a comparison with similar homes in the area
Home Values in the Area
Average Home Value in this Area
Purchase History
| Date | Buyer | Sale Price | Title Company |
|---|---|---|---|
| Burwell Michael | $65,900 | None Available | |
| Harrington Of Sycamore Ltd | $55,000 | -- | |
| Schalk Properties Ltd | -- | -- | |
| Martien Debra S | $47,000 | -- | |
| Martien Debra S | -- | -- | |
| -- | $22,700 | -- |
Source: Public Records
Mortgage History
| Date | Status | Borrower | Loan Amount |
|---|---|---|---|
| Open | Burwell Michael | $62,605 |
Source: Public Records
Tax History Compared to Growth
Tax History
| Year | Tax Paid | Tax Assessment Tax Assessment Total Assessment is a certain percentage of the fair market value that is determined by local assessors to be the total taxable value of land and additions on the property. | Land | Improvement |
|---|---|---|---|---|
| 2024 | $783 | $32,020 | $2,980 | $29,040 |
| 2023 | $784 | $32,020 | $2,980 | $29,040 |
| 2022 | $629 | $23,940 | $2,580 | $21,360 |
| 2021 | $634 | $23,940 | $2,580 | $21,360 |
| 2020 | $646 | $23,940 | $2,583 | $21,357 |
| 2019 | $988 | $22,331 | $2,482 | $19,849 |
| 2018 | $990 | $22,331 | $2,482 | $19,849 |
| 2017 | $945 | $22,331 | $2,482 | $19,849 |
| 2016 | $899 | $20,535 | $2,405 | $18,130 |
| 2015 | $889 | $20,535 | $2,405 | $18,130 |
| 2014 | $839 | $20,535 | $2,405 | $18,130 |
| 2013 | $897 | $21,172 | $2,482 | $18,690 |
Source: Public Records
Map
Nearby Homes
- 29 Virginia Ave
- 2695 Ohio 18
- 39 Cherry St
- 314 S Sandusky St
- 0 Miami St Unit 20242078
- 0 Miami St Unit 6116475
- 17 Franklin St
- 28 Orange St
- 115 Lindsay Ave
- 169 Nelson St
- 0 Township Road 198a Unit 20242098
- 0 Township Road 198a Unit 6116514
- 50 Clay St
- 48 Clay St
- 215 Hudson St
- 0 W Market St
- 190 Hall St
- 311 Noble St
- 52 Hall St
- 123 Apple St
- 272 W Perry St
- 280 W Perry St
- 282 W Perry St
- 268 W Perry St
- 286 W Perry St
- 264 W Perry St
- 269 W Perry St
- 277 W Perry St
- 292 W Perry St
- 35 Virginia Ave
- 281 W Perry St
- 273 W Perry St
- 256 W Perry St
- 41 Virginia Ave
- 267 W Perry St
- 45 Virginia Ave
- 285 W Perry St
- 261 W Perry St
- 250 W Perry St
- 51 Virginia Ave