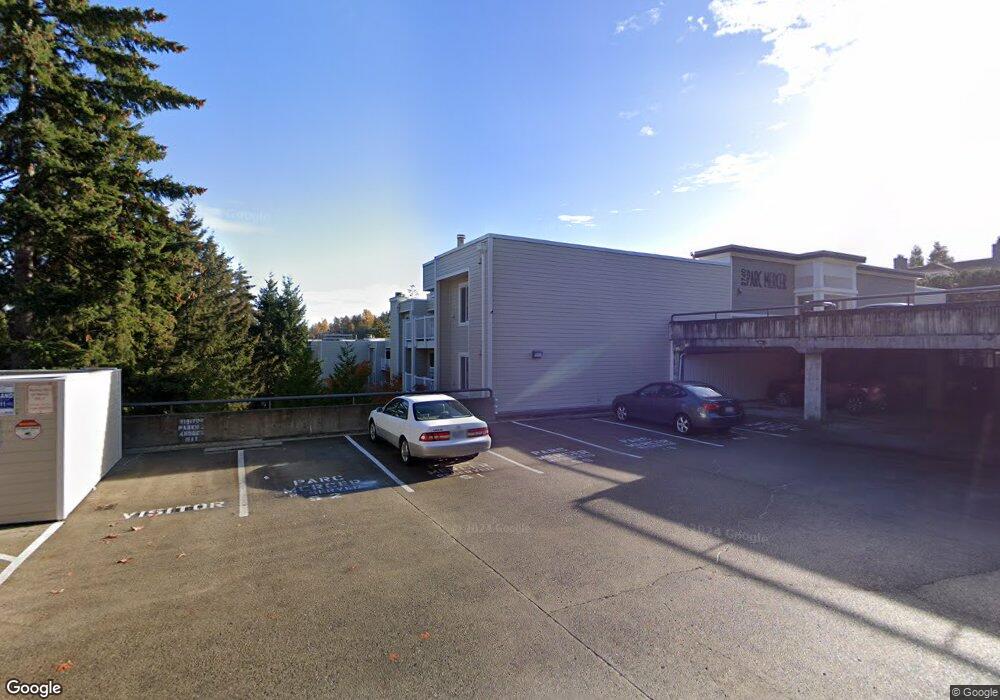
2740 76th Ave SE Unit A309 Mercer Island, WA 98040
Downtown Mercer Island NeighborhoodEstimated Value: $607,988 - $665,000
2
Beds
2
Baths
1,118
Sq Ft
$579/Sq Ft
Est. Value
About This Home
This home is located at 2740 76th Ave SE Unit A309, Mercer Island, WA 98040 and is currently estimated at $647,747, approximately $579 per square foot. 2740 76th Ave SE Unit A309 is a home located in King County with nearby schools including West Mercer Elementary School, Islander Middle School, and Mercer Island High School.
Ownership History
Date
Name
Owned For
Owner Type
Purchase Details
Closed on
Aug 5, 2010
Sold by
Wong Annie On Yee
Bought by
Wong Connie and Wong Jannie Kan Yee
Current Estimated Value
Home Financials for this Owner
Home Financials are based on the most recent Mortgage that was taken out on this home.
Original Mortgage
$152,550
Outstanding Balance
$100,748
Interest Rate
4.52%
Mortgage Type
New Conventional
Estimated Equity
$546,999
Purchase Details
Closed on
Oct 25, 2006
Sold by
Jones Gregory Scott and Jones Christopher
Bought by
Wong Connie and Wong Jannie Kan Yee
Purchase Details
Closed on
Jul 14, 2006
Sold by
Jones Margot
Bought by
Jones Gregory Scott and Jones Christopher Mark
Purchase Details
Closed on
Nov 7, 1996
Sold by
Fix Jenifer L and Fix Tabet Jennifer L
Bought by
Jones Margot
Create a Home Valuation Report for This Property
The Home Valuation Report is an in-depth analysis detailing your home's value as well as a comparison with similar homes in the area
Home Values in the Area
Average Home Value in this Area
Purchase History
| Date | Buyer | Sale Price | Title Company |
|---|---|---|---|
| Wong Connie | -- | The Talon Grou | |
| Wong Connie | $355,000 | Chicago Title | |
| Jones Gregory Scott | -- | Chicago Title | |
| Jones Margot | $155,000 | Chicago Title Insurance Co |
Source: Public Records
Mortgage History
| Date | Status | Borrower | Loan Amount |
|---|---|---|---|
| Open | Wong Connie | $152,550 |
Source: Public Records
Tax History Compared to Growth
Tax History
| Year | Tax Paid | Tax Assessment Tax Assessment Total Assessment is a certain percentage of the fair market value that is determined by local assessors to be the total taxable value of land and additions on the property. | Land | Improvement |
|---|---|---|---|---|
| 2024 | $3,828 | $582,000 | $287,000 | $295,000 |
| 2023 | $3,696 | $657,000 | $279,900 | $377,100 |
| 2022 | $3,726 | $600,000 | $272,700 | $327,300 |
| 2021 | $4,073 | $504,000 | $215,300 | $288,700 |
| 2020 | $3,814 | $507,000 | $215,300 | $291,700 |
| 2018 | $3,620 | $493,000 | $152,100 | $340,900 |
| 2017 | $2,770 | $416,000 | $140,600 | $275,400 |
| 2016 | $2,794 | $339,000 | $139,200 | $199,800 |
| 2015 | $2,416 | $333,000 | $139,200 | $193,800 |
| 2014 | -- | $275,000 | $122,000 | $153,000 |
| 2013 | -- | $183,000 | $122,000 | $61,000 |
Source: Public Records
Map
Nearby Homes
- 7600 SE 29th St Unit A501
- 2920 76th Ave SE Unit 411
- 2918 74th Ave SE
- 7800 SE 27th St Unit 503
- 2949 76th Ave SE Unit 81D
- 2965 74th Ave SE
- 3055 80th Ave SE Unit 107
- 7930 SE 34th St Unit 513
- 28 XX 68th Ave SE
- 8351 SE 31st St
- 2236 66th Ave SE
- 7254 N Mercer Way
- 2440 64th Ave SE
- 6950 SE Maker St
- 8428 N Mercer Way
- 7929 SE 37th St
- 7220 N Mercer Way
- 73 xx SE 38th St
- 3639 W Mercer Way
- 3706 84th Ave SE
- 2740 76th Ave SE
- 2740 76th Ave SE Unit A409
- 2740 76th Ave SE Unit A105
- 2740 76th Ave SE Unit A209
- 2740 76th Ave SE Unit A503
- 2740 76th Ave SE Unit A201
- 2740 76th Ave SE Unit A205
- 2740 76th Ave SE Unit A301
- 2740 76th Ave SE Unit A302
- 2740 76th Ave SE Unit A306
- 2740 76th Ave SE Unit A504
- 2740 76th Ave SE Unit A110
- 2740 76th Ave SE Unit A208
- 2740 76th Ave SE Unit A303
- 2740 76th Ave SE Unit A106
- 2740 76th Ave SE Unit A407
- 2740 76th Ave SE Unit A502
- 2740 76th Ave SE Unit A304
- 2740 76th Ave SE Unit A206
- 2740 76th Ave SE Unit A203