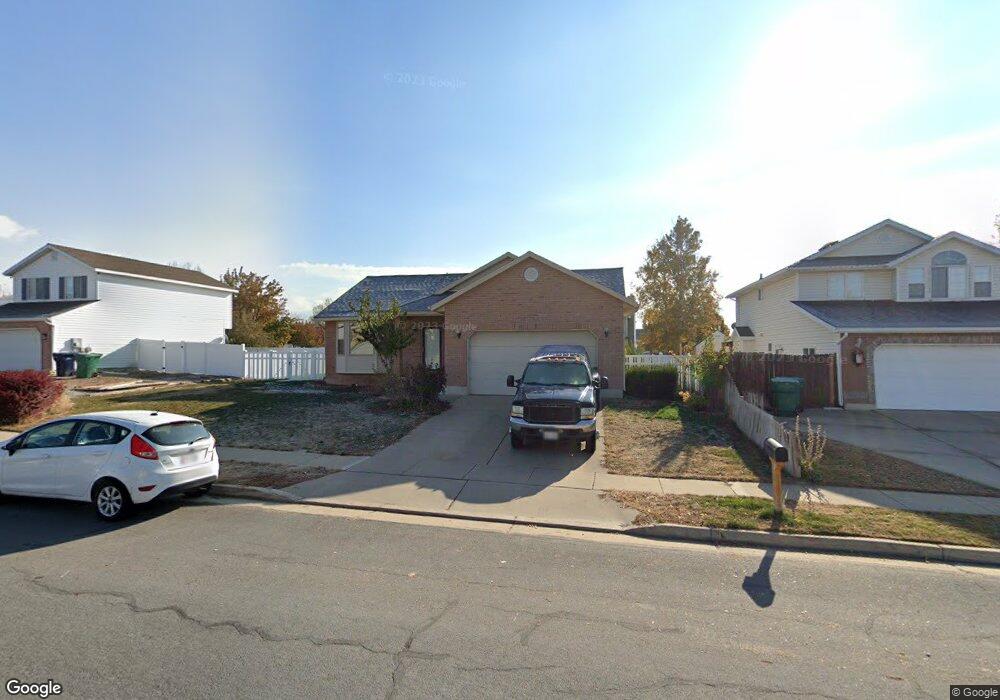
2741 Brady Way Layton, UT 84041
Estimated Value: $493,000 - $533,000
4
Beds
3
Baths
2,700
Sq Ft
$191/Sq Ft
Est. Value
About This Home
This home is located at 2741 Brady Way, Layton, UT 84041 and is currently estimated at $517,009, approximately $191 per square foot. 2741 Brady Way is a home located in Davis County with nearby schools including Legacy Junior High School, Layton High School, and North Davis Preparatory Academy.
Ownership History
Date
Name
Owned For
Owner Type
Purchase Details
Closed on
Aug 26, 2005
Sold by
Arcalas Jerry Q
Bought by
Arcalas Jerry Q and Arcalas Hyesu Y
Current Estimated Value
Home Financials for this Owner
Home Financials are based on the most recent Mortgage that was taken out on this home.
Original Mortgage
$184,891
Outstanding Balance
$96,813
Interest Rate
5.61%
Mortgage Type
VA
Estimated Equity
$420,196
Purchase Details
Closed on
Aug 25, 2005
Sold by
Green Blake C and Green Kammy L
Bought by
Arcalas Jerry Q
Home Financials for this Owner
Home Financials are based on the most recent Mortgage that was taken out on this home.
Original Mortgage
$184,891
Outstanding Balance
$96,813
Interest Rate
5.61%
Mortgage Type
VA
Estimated Equity
$420,196
Purchase Details
Closed on
Jan 26, 1999
Sold by
Staciokas David M
Bought by
Green Blake C and Green Kammy L
Home Financials for this Owner
Home Financials are based on the most recent Mortgage that was taken out on this home.
Original Mortgage
$131,100
Interest Rate
6.63%
Create a Home Valuation Report for This Property
The Home Valuation Report is an in-depth analysis detailing your home's value as well as a comparison with similar homes in the area
Home Values in the Area
Average Home Value in this Area
Purchase History
| Date | Buyer | Sale Price | Title Company |
|---|---|---|---|
| Arcalas Jerry Q | -- | First American Title | |
| Arcalas Jerry Q | -- | Bonneville Title Company | |
| Green Blake C | -- | Associated Title Co |
Source: Public Records
Mortgage History
| Date | Status | Borrower | Loan Amount |
|---|---|---|---|
| Open | Arcalas Jerry Q | $184,891 | |
| Previous Owner | Green Blake C | $131,100 |
Source: Public Records
Tax History
| Year | Tax Paid | Tax Assessment Tax Assessment Total Assessment is a certain percentage of the fair market value that is determined by local assessors to be the total taxable value of land and additions on the property. | Land | Improvement |
|---|---|---|---|---|
| 2025 | $2,562 | $268,950 | $103,401 | $165,549 |
| 2024 | $2,471 | $261,250 | $115,895 | $145,355 |
| 2023 | $2,355 | $439,000 | $111,668 | $327,332 |
| 2022 | $2,576 | $260,700 | $71,868 | $188,832 |
| 2021 | $2,332 | $352,000 | $107,842 | $244,158 |
| 2020 | $2,106 | $305,000 | $90,137 | $214,863 |
| 2019 | $2,038 | $289,000 | $94,137 | $194,863 |
| 2018 | $1,840 | $262,000 | $82,380 | $179,620 |
| 2016 | $1,730 | $127,105 | $31,530 | $95,575 |
| 2015 | $1,642 | $114,510 | $31,530 | $82,980 |
| 2014 | $1,653 | $117,839 | $31,530 | $86,309 |
| 2013 | -- | $108,798 | $28,952 | $79,846 |
Source: Public Records
Map
Nearby Homes
- 1250 N 2925 W
- 1445 N 2925 W
- 2127 S 350 E
- 2601 S 200 E
- 154 E 2325 S
- 1477 N 2375 W
- 308 E 1925 S
- 2480 S Main St
- 1141 N 2275 W
- 818 N 2625 W
- 1430 N 2100 W
- 2057 S James Cir
- 1888 W 1575 N Unit 235
- 1961 S 100 W
- 460 E 1700 S Unit 1 & 2
- 1491 N 1875 W
- 1491 N 1875 W Unit 158
- 1487 N 1875 W
- 1487 N 1875 W Unit 159
- 1483 N 1875 W