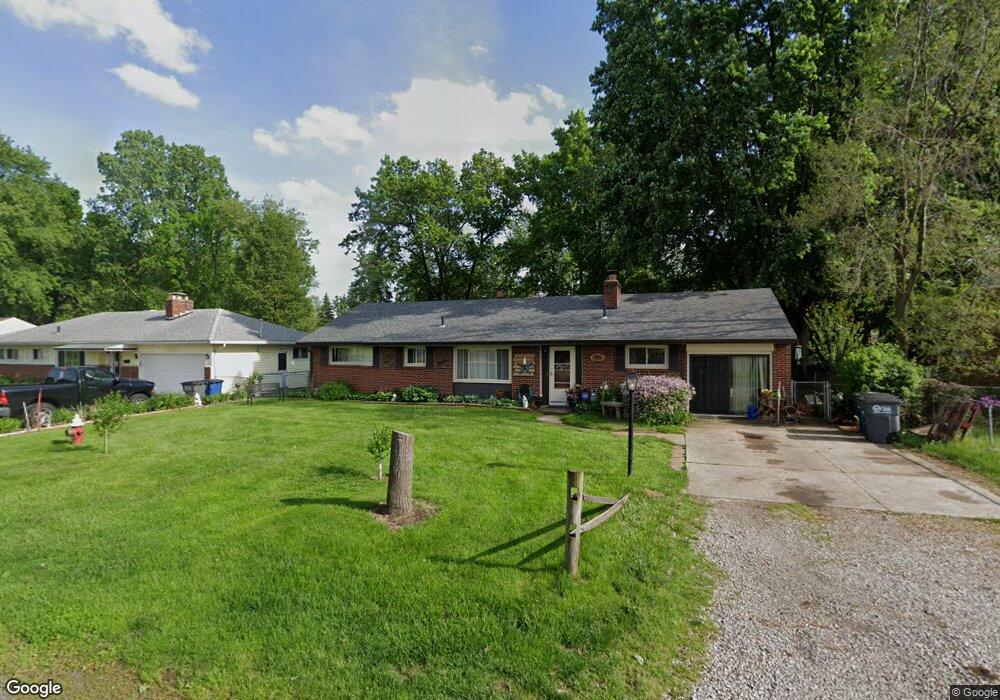
2741 Lyceum Place Toledo, OH 43613
Whitmer-Trilby NeighborhoodEstimated Value: $167,523 - $188,000
3
Beds
2
Baths
1,850
Sq Ft
$96/Sq Ft
Est. Value
About This Home
This home is located at 2741 Lyceum Place, Toledo, OH 43613 and is currently estimated at $177,881, approximately $96 per square foot. 2741 Lyceum Place is a home located in Lucas County with nearby schools including Jefferson Junior High School, Washington Junior High School, and Whitmer High School.
Ownership History
Date
Name
Owned For
Owner Type
Purchase Details
Closed on
Jul 2, 2021
Sold by
Papio Joe K
Bought by
Tiefenbacher Danyel and Lai Jamie
Current Estimated Value
Home Financials for this Owner
Home Financials are based on the most recent Mortgage that was taken out on this home.
Original Mortgage
$7,495
Outstanding Balance
$6,712
Interest Rate
2.9%
Mortgage Type
FHA
Estimated Equity
$171,169
Purchase Details
Closed on
Mar 6, 2019
Sold by
Traczyk Kimberly R and Traczyk Jamie
Bought by
Traczyk Kimberly R
Purchase Details
Closed on
Jun 20, 2012
Sold by
Obrien David Franklin
Bought by
Obrien Sharon Ann
Purchase Details
Closed on
Dec 18, 2006
Sold by
Oreilly Obrien Sharon Ann and Obrien David Franklin
Bought by
Obrien David Franklin and Oreilly Obrien Sharon Ann
Purchase Details
Closed on
Dec 19, 2001
Sold by
Oreilly Sharon A and Ann Sharon
Bought by
Oreilly Obrien Sharon Ann and Obrien David Franklin
Create a Home Valuation Report for This Property
The Home Valuation Report is an in-depth analysis detailing your home's value as well as a comparison with similar homes in the area
Home Values in the Area
Average Home Value in this Area
Purchase History
| Date | Buyer | Sale Price | Title Company |
|---|---|---|---|
| Tiefenbacher Danyel | $34,000 | Area Title Agency | |
| Traczyk Kimberly R | $43,650 | Title Source Inc | |
| Obrien Sharon Ann | -- | None Available | |
| Obrien David Franklin | -- | Attorney | |
| Oreilly Obrien Sharon Ann | -- | -- |
Source: Public Records
Mortgage History
| Date | Status | Borrower | Loan Amount |
|---|---|---|---|
| Open | Tiefenbacher Danyel | $7,495 |
Source: Public Records
Tax History Compared to Growth
Tax History
| Year | Tax Paid | Tax Assessment Tax Assessment Total Assessment is a certain percentage of the fair market value that is determined by local assessors to be the total taxable value of land and additions on the property. | Land | Improvement |
|---|---|---|---|---|
| 2024 | $1,403 | $43,400 | $8,575 | $34,825 |
| 2023 | $3,109 | $41,790 | $7,980 | $33,810 |
| 2022 | $3,072 | $41,790 | $7,980 | $33,810 |
| 2021 | $3,158 | $41,790 | $7,980 | $33,810 |
| 2020 | $3,100 | $35,070 | $6,615 | $28,455 |
| 2019 | $3,003 | $35,070 | $6,615 | $28,455 |
| 2018 | $2,140 | $35,070 | $6,615 | $28,455 |
| 2017 | $1,894 | $30,555 | $5,355 | $25,200 |
| 2016 | $1,914 | $87,300 | $15,300 | $72,000 |
| 2015 | $1,948 | $87,300 | $15,300 | $72,000 |
| 2014 | $1,486 | $30,560 | $5,360 | $25,200 |
| 2013 | $1,486 | $30,560 | $5,360 | $25,200 |
Source: Public Records
Map
Nearby Homes
- 2604 Arletta St
- 2617 Schroeder St
- 5658 Adelaide Dr
- 5501 Ruth Ave
- 2437 Murray Dr
- 2809 Trimble Rd
- 2424 Bodette Ave
- 2410 Newport Ave
- 5211 Douglas Rd
- 2329 Ida Dr
- 5233 Adella St
- 5627 Chippewa Rd
- 5902 Deane Dr
- 5111 Elaine Dr
- 2315 Ann Dr
- 5951 Everwood Rd
- 5213 Fairgreen Dr
- 2849 W Laskey Rd
- 2824 Nash Rd
- 2620 Elmridge Rd
- 2749 Lyceum Place
- 2733 Lyceum Place
- 5454 Asta Ct
- 2757 Lyceum Place
- 2725 Lyceum Place
- 5458 Asta Ct
- 5453 Falla Ct
- 5452 Asta Ct
- 2765 Lyceum Place
- 5451 Falla Ct
- 5457 Asta Ct
- 2719 Lyceum Place
- 5457 Falla Ct
- 5448 Asta Ct
- 2771 Lyceum Place
- 5447 Falla Ct
- 5453 Asta Ct
- 5458 Falla Ct
- 2711 Lyceum Place
- 2779 Lyceum Place