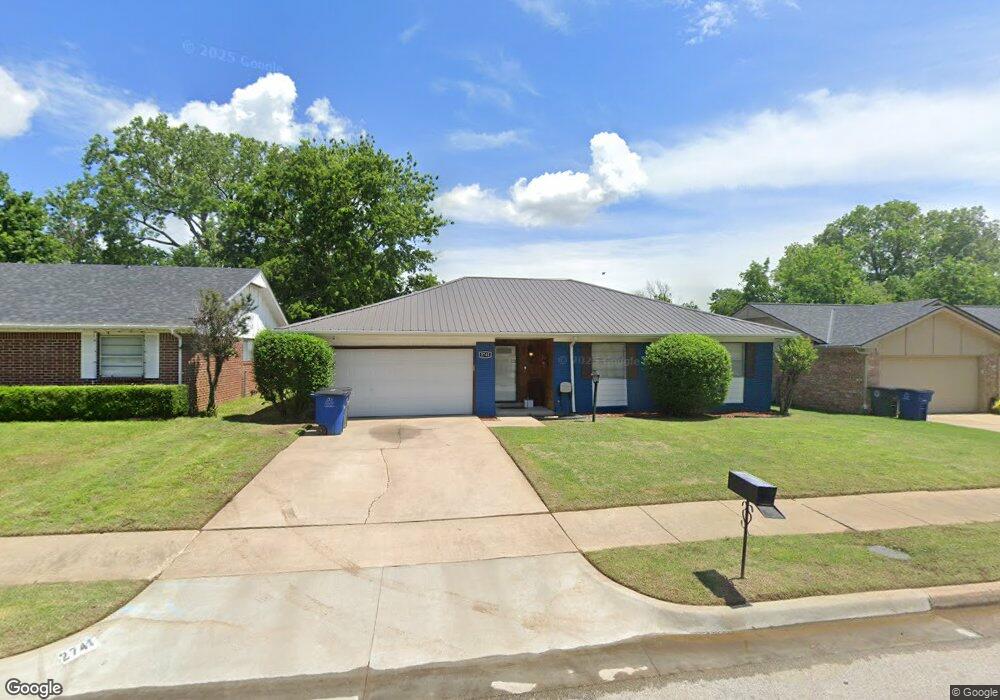
2741 S 116th East Ave Tulsa, OK 74129
Meadows NeighborhoodEstimated Value: $163,000 - $194,000
--
Bed
2
Baths
1,428
Sq Ft
$125/Sq Ft
Est. Value
About This Home
This home is located at 2741 S 116th East Ave, Tulsa, OK 74129 and is currently estimated at $178,568, approximately $125 per square foot. 2741 S 116th East Ave is a home located in Tulsa County with nearby schools including Disney Elementary School, East Central High School, and College Bound Academy.
Ownership History
Date
Name
Owned For
Owner Type
Purchase Details
Closed on
Dec 30, 2024
Sold by
Terry Robert E and Terry Anna M
Bought by
Robert And Anna Terry Revocable Living Trust
Current Estimated Value
Purchase Details
Closed on
Apr 26, 2013
Sold by
Terry Anna Marie and Terry Robert E
Bought by
Terry Anna Marie and Terry Robert E
Home Financials for this Owner
Home Financials are based on the most recent Mortgage that was taken out on this home.
Original Mortgage
$85,200
Interest Rate
3.67%
Mortgage Type
VA
Purchase Details
Closed on
Jun 2, 2006
Sold by
Fugett Mark A and Fugett Becky A
Bought by
Qi Guo Gang and Whitman Qi Laura Anne
Home Financials for this Owner
Home Financials are based on the most recent Mortgage that was taken out on this home.
Original Mortgage
$77,400
Interest Rate
5.62%
Mortgage Type
Fannie Mae Freddie Mac
Create a Home Valuation Report for This Property
The Home Valuation Report is an in-depth analysis detailing your home's value as well as a comparison with similar homes in the area
Home Values in the Area
Average Home Value in this Area
Purchase History
| Date | Buyer | Sale Price | Title Company |
|---|---|---|---|
| Robert And Anna Terry Revocable Living Trust | -- | None Listed On Document | |
| Terry Anna Marie | -- | Executives Title & Escrow Co | |
| Terry Anna Marie | $83,500 | Executives Title & Escrow C | |
| Qi Guo Gang | $86,000 | None Available |
Source: Public Records
Mortgage History
| Date | Status | Borrower | Loan Amount |
|---|---|---|---|
| Previous Owner | Terry Anna Marie | $85,200 | |
| Previous Owner | Qi Guo Gang | $77,400 |
Source: Public Records
Tax History Compared to Growth
Tax History
| Year | Tax Paid | Tax Assessment Tax Assessment Total Assessment is a certain percentage of the fair market value that is determined by local assessors to be the total taxable value of land and additions on the property. | Land | Improvement |
|---|---|---|---|---|
| 2024 | $1,559 | $12,897 | $1,829 | $11,068 |
| 2023 | $1,559 | $12,283 | $1,707 | $10,576 |
| 2022 | $1,560 | $11,698 | $1,863 | $9,835 |
| 2021 | $1,471 | $11,141 | $1,774 | $9,367 |
| 2020 | $1,382 | $10,610 | $1,689 | $8,921 |
| 2019 | $1,385 | $10,105 | $1,980 | $8,125 |
| 2018 | $1,388 | $10,105 | $1,980 | $8,125 |
| 2017 | $1,385 | $10,105 | $1,980 | $8,125 |
| 2016 | $1,295 | $9,645 | $1,890 | $7,755 |
| 2015 | $1,235 | $9,185 | $2,024 | $7,161 |
| 2014 | $1,224 | $9,185 | $2,024 | $7,161 |
Source: Public Records
Map
Nearby Homes
- 2764 S 117th East Ave
- 11612 E 28th St
- 2511 S 121st East Ave
- 2428 S 121st East Ave
- 11010 E 26th St
- 2503 S 122nd East Ave
- 10918 E 28th Place
- 2609 S 109th East Ave
- 3104 S 115th East Ave
- 10715 E 27th St
- 10935 E 23rd St
- 3256 S 121st East Ave
- 10704 E 26th St
- 3309 S 116th East Place
- 12130 E 21st Place
- 9751 E 31st St
- 10821 E 33rd Place
- 3430 S 116th East Place
- 3225 S 126th East Ave
- 12324 E 20th Place
- 2747 S 116th East Ave
- 2737 S 116th East Ave
- 2747 S 116th East Ave
- 2716 S 116th East Place
- 2720 S 116th East Place
- 2751 S 116th East Ave
- 2712 S 116th East Place
- 2731 S 116th East Ave
- 2746 S 116th East Ave
- 2726 S 116th East Place
- 2706 S 116th East Place
- 2752 S 116th East Ave
- 2757 S 116th East Ave
- 2740 S 116th East Ave
- 2727 S 116th East Ave
- 2736 S 116th East Ave
- 2730 S 116th East Place
- 2732 S 116th Ave E
- 2732 S 116th East Ave
- 11545 E 27th Ct