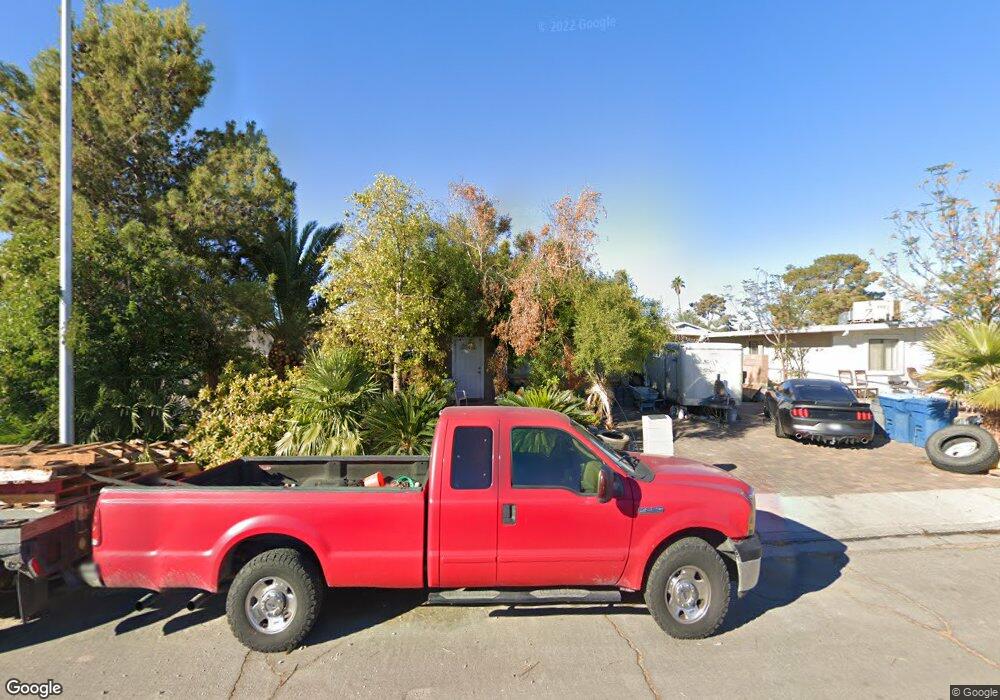
2741 San Marcos St Las Vegas, NV 89115
Estimated Value: $248,000 - $318,000
3
Beds
2
Baths
1,080
Sq Ft
$270/Sq Ft
Est. Value
About This Home
This home is located at 2741 San Marcos St, Las Vegas, NV 89115 and is currently estimated at $292,071, approximately $270 per square foot. 2741 San Marcos St is a home located in Clark County with nearby schools including Myrtle Tate Elementary School, Von Tobel Middle School, and Sunrise Mountain High School.
Ownership History
Date
Name
Owned For
Owner Type
Purchase Details
Closed on
Jul 9, 2025
Sold by
Espinoza Horacio
Bought by
Balderas Horacio Espinoza and Ibarra Oscar Alejandro Sa
Current Estimated Value
Purchase Details
Closed on
Feb 11, 2015
Sold by
Rodriguez Doroteo
Bought by
Espinoza Horacia
Purchase Details
Closed on
Nov 11, 2004
Sold by
Fung Kenneth
Bought by
Espinoza Horacio and Rodriguez Doroteo
Home Financials for this Owner
Home Financials are based on the most recent Mortgage that was taken out on this home.
Original Mortgage
$144,850
Interest Rate
5.7%
Mortgage Type
Unknown
Purchase Details
Closed on
Aug 1, 2003
Sold by
Corker Brenda
Bought by
Fung Kenneth
Home Financials for this Owner
Home Financials are based on the most recent Mortgage that was taken out on this home.
Original Mortgage
$110,000
Interest Rate
5.6%
Mortgage Type
Unknown
Create a Home Valuation Report for This Property
The Home Valuation Report is an in-depth analysis detailing your home's value as well as a comparison with similar homes in the area
Home Values in the Area
Average Home Value in this Area
Purchase History
| Date | Buyer | Sale Price | Title Company |
|---|---|---|---|
| Balderas Horacio Espinoza | $121,517 | None Listed On Document | |
| Espinoza Horacia | -- | None Available | |
| Espinoza Horacio | $149,350 | Equity Title Of Nevada | |
| Fung Kenneth | $110,000 | Old Republic Title Co Of Ne |
Source: Public Records
Mortgage History
| Date | Status | Borrower | Loan Amount |
|---|---|---|---|
| Previous Owner | Espinoza Horacio | $144,850 | |
| Previous Owner | Fung Kenneth | $110,000 |
Source: Public Records
Tax History Compared to Growth
Tax History
| Year | Tax Paid | Tax Assessment Tax Assessment Total Assessment is a certain percentage of the fair market value that is determined by local assessors to be the total taxable value of land and additions on the property. | Land | Improvement |
|---|---|---|---|---|
| 2025 | $913 | $42,531 | $28,000 | $14,531 |
| 2024 | $860 | $42,531 | $28,000 | $14,531 |
| 2023 | $484 | $39,780 | $26,600 | $13,180 |
| 2022 | $811 | $34,140 | $22,400 | $11,740 |
| 2021 | $1,016 | $30,894 | $19,950 | $10,944 |
| 2020 | $454 | $28,786 | $17,500 | $11,286 |
| 2019 | $426 | $26,529 | $15,050 | $11,479 |
| 2018 | $406 | $24,290 | $12,950 | $11,340 |
| 2017 | $654 | $22,308 | $10,500 | $11,808 |
| 2016 | $484 | $18,838 | $6,300 | $12,538 |
| 2015 | $631 | $18,647 | $5,950 | $12,697 |
| 2014 | $470 | $12,182 | $4,200 | $7,982 |
Source: Public Records
Map
Nearby Homes
- 2741 San Domingo Ln
- 2671 San Marcos St
- 3644 San Pascual Ave
- 2921 Country Manor Ln Unit 139
- 2941 Country Manor Ln Unit 27
- 2642 San Vincente Ct
- 2564 San Marcos St
- 2549 San Marcos St
- 3846 Soda Springs Dr
- 3873 Soda Springs Dr
- 2514 Sandy Ln
- 2981 Country Manor Ln Unit 118
- 2981 Country Manor Ln Unit 2
- 2732 Vita Dr
- 2740 Vita Dr
- 2531 Oak Glen Way
- 3844 Fitzpatrick Dr
- 2481 San Marcos St
- 3804 Haddock Ave
- 3749 Ponderosa St
- 2751 San Marcos St
- 2731 San Marcos St
- 2740 Sandy Ln
- 2761 San Marcos St
- 2721 San Marcos St
- 2750 Sandy Ln
- 2730 Sandy Ln
- 2760 Sandy Ln
- 2720 Sandy Ln
- 2740 San Marcos St Unit 3
- 2730 San Marcos St
- 2711 San Marcos St Unit 2
- 2750 San Marcos St
- 3845 San Francisco Ave
- 2720 San Marcos St
- 3843 San Francisco Ave
- 2710 Sandy Ln
- 2760 San Marcos St
- 3841 San Francisco Ave
- 2710 San Marcos St