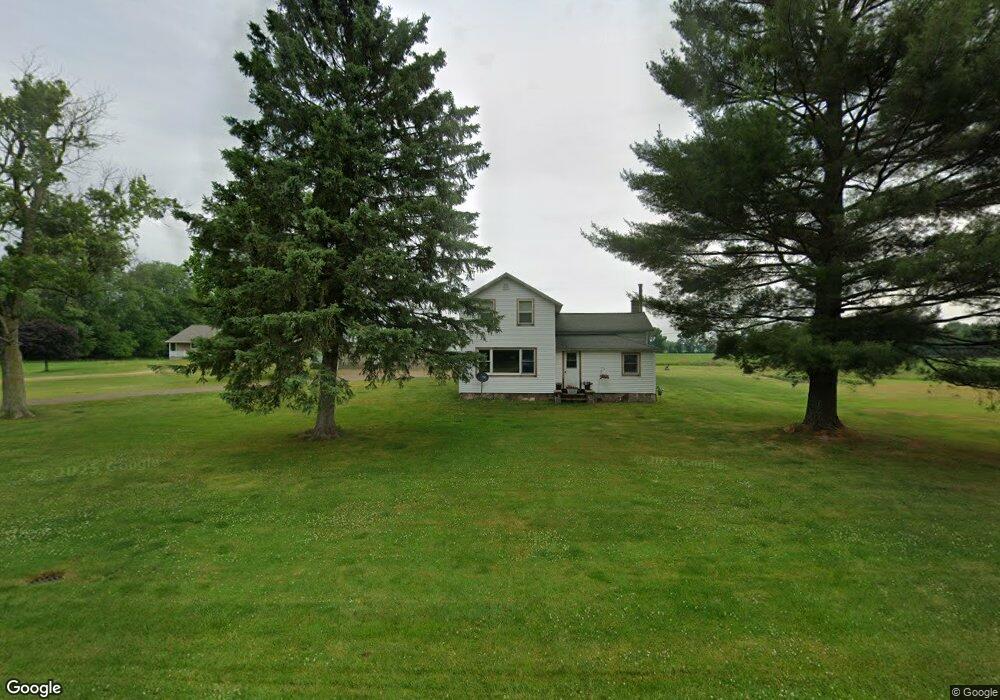
2743 120th Ave Allegan, MI 49010
Estimated Value: $332,000 - $467,807
3
Beds
1
Bath
1,408
Sq Ft
$284/Sq Ft
Est. Value
About This Home
This home is located at 2743 120th Ave, Allegan, MI 49010 and is currently estimated at $399,904, approximately $284 per square foot. 2743 120th Ave is a home located in Allegan County with nearby schools including North Ward Elementary School, L.E. White Middle School, and Allegan High School.
Ownership History
Date
Name
Owned For
Owner Type
Purchase Details
Closed on
Jul 14, 2021
Sold by
Kline Kay A
Bought by
Shank Chris A and Shank Dawn M
Current Estimated Value
Home Financials for this Owner
Home Financials are based on the most recent Mortgage that was taken out on this home.
Original Mortgage
$106,500
Outstanding Balance
$65,837
Interest Rate
2.9%
Mortgage Type
Purchase Money Mortgage
Estimated Equity
$334,067
Purchase Details
Closed on
Nov 14, 2006
Sold by
Kiefer Joan E
Bought by
Shank Chris and Shank Dawn
Purchase Details
Closed on
Apr 28, 2006
Sold by
Kline Kay A
Bought by
Shank Christopher and Shank Dawn
Home Financials for this Owner
Home Financials are based on the most recent Mortgage that was taken out on this home.
Original Mortgage
$147,600
Interest Rate
6.37%
Mortgage Type
Fannie Mae Freddie Mac
Create a Home Valuation Report for This Property
The Home Valuation Report is an in-depth analysis detailing your home's value as well as a comparison with similar homes in the area
Home Values in the Area
Average Home Value in this Area
Purchase History
| Date | Buyer | Sale Price | Title Company |
|---|---|---|---|
| Shank Chris A | -- | None Available | |
| Shank Chris | -- | None Available | |
| Shank Christopher | $164,000 | Nations Title Agency Of Mi |
Source: Public Records
Mortgage History
| Date | Status | Borrower | Loan Amount |
|---|---|---|---|
| Open | Shank Chris A | $106,500 | |
| Previous Owner | Shank Christopher | $147,600 |
Source: Public Records
Tax History Compared to Growth
Tax History
| Year | Tax Paid | Tax Assessment Tax Assessment Total Assessment is a certain percentage of the fair market value that is determined by local assessors to be the total taxable value of land and additions on the property. | Land | Improvement |
|---|---|---|---|---|
| 2025 | $1,317 | $168,900 | $87,600 | $81,300 |
| 2024 | $1,200 | $160,000 | $81,300 | $78,700 |
| 2023 | $1,200 | $145,000 | $76,300 | $68,700 |
| 2022 | $1,200 | $124,000 | $64,800 | $59,200 |
| 2021 | $1,108 | $131,300 | $74,700 | $56,600 |
| 2020 | $1,108 | $126,000 | $70,300 | $55,700 |
| 2019 | $0 | $120,900 | $70,300 | $50,600 |
| 2018 | $0 | $119,600 | $72,800 | $46,800 |
| 2017 | $0 | $101,800 | $64,700 | $37,100 |
| 2016 | $0 | $101,800 | $63,300 | $38,500 |
| 2015 | -- | $101,800 | $63,300 | $38,500 |
| 2014 | -- | $91,000 | $58,800 | $32,200 |
| 2013 | -- | $94,700 | $56,800 | $37,900 |
Source: Public Records
Map
Nearby Homes