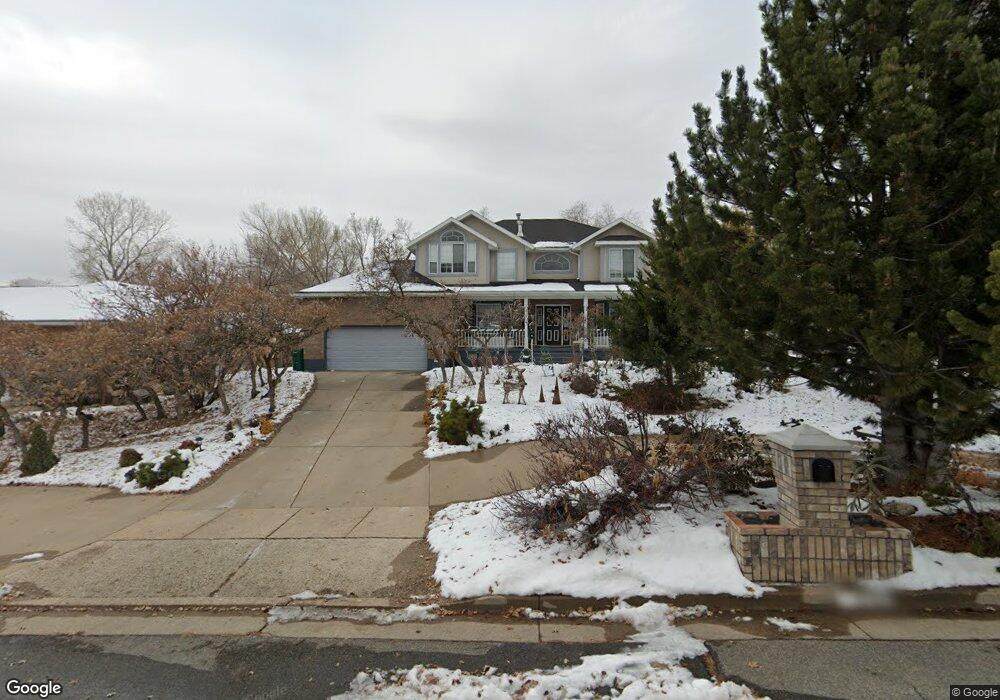
2743 E 1700 N Layton, UT 84040
Estimated Value: $666,000 - $724,000
5
Beds
3
Baths
3,604
Sq Ft
$190/Sq Ft
Est. Value
About This Home
This home is located at 2743 E 1700 N, Layton, UT 84040 and is currently estimated at $685,814, approximately $190 per square foot. 2743 E 1700 N is a home located in Davis County with nearby schools including East Layton Elementary School, Central Davis Junior High School, and Northridge High School.
Ownership History
Date
Name
Owned For
Owner Type
Purchase Details
Closed on
Apr 8, 2021
Sold by
Wixom Dennis J and Wixom Narumi
Bought by
Wixom Dennis J and Wixom Narumi
Current Estimated Value
Purchase Details
Closed on
Apr 8, 2011
Sold by
Wixom Dennis J and Wixom Narumi
Bought by
Wixom Dennis J and Wixom Narumi
Purchase Details
Closed on
May 24, 2005
Sold by
Wixom Rayetta S and Mickel Rayette S
Bought by
Wixom Dennis J
Home Financials for this Owner
Home Financials are based on the most recent Mortgage that was taken out on this home.
Original Mortgage
$206,150
Interest Rate
5.25%
Mortgage Type
Fannie Mae Freddie Mac
Purchase Details
Closed on
Oct 16, 2002
Sold by
Wixom Dennis John and Wixom Rayetta S
Bought by
Wixom Rayetta S
Home Financials for this Owner
Home Financials are based on the most recent Mortgage that was taken out on this home.
Original Mortgage
$125,000
Interest Rate
5.89%
Create a Home Valuation Report for This Property
The Home Valuation Report is an in-depth analysis detailing your home's value as well as a comparison with similar homes in the area
Home Values in the Area
Average Home Value in this Area
Purchase History
| Date | Buyer | Sale Price | Title Company |
|---|---|---|---|
| Wixom Dennis J | -- | None Available | |
| Wixom Dennis J | -- | Thomas Ryan | |
| Wixom Dennis J | -- | United Title Svcs Of Utah | |
| Wixom Rayetta S | -- | Equity Title Agency |
Source: Public Records
Mortgage History
| Date | Status | Borrower | Loan Amount |
|---|---|---|---|
| Previous Owner | Wixom Dennis J | $206,150 | |
| Previous Owner | Wixom Rayetta S | $125,000 |
Source: Public Records
Tax History
| Year | Tax Paid | Tax Assessment Tax Assessment Total Assessment is a certain percentage of the fair market value that is determined by local assessors to be the total taxable value of land and additions on the property. | Land | Improvement |
|---|---|---|---|---|
| 2025 | $2,987 | $313,500 | $178,612 | $134,888 |
| 2024 | $2,840 | $300,300 | $190,549 | $109,751 |
| 2023 | $2,908 | $542,000 | $235,802 | $306,198 |
| 2022 | $3,059 | $309,650 | $128,274 | $181,376 |
| 2021 | $2,862 | $432,000 | $198,126 | $233,874 |
| 2020 | $2,603 | $377,000 | $172,471 | $204,529 |
| 2019 | $2,580 | $366,000 | $151,396 | $214,604 |
| 2018 | $2,402 | $342,000 | $127,768 | $214,232 |
| 2016 | $2,287 | $167,970 | $79,339 | $88,631 |
| 2015 | $2,337 | $162,965 | $79,339 | $83,626 |
| 2014 | $2,271 | $161,908 | $79,339 | $82,569 |
| 2013 | -- | $161,278 | $44,185 | $117,093 |
Source: Public Records
Map
Nearby Homes
- 1954 N 2600 E
- 2547 E 1900 N
- 2509 E 1900 N
- 1752 N Valley View Dr
- 2231 N Valley View Dr
- 1870 N Valley View Dr Unit 201
- 2391 Kays Creek Dr
- 2136 N 2800 E
- 1332 N 2350 E
- 1907 N Bridge Ct
- 2563 E 2250 N
- 2124 E Cherry Ln
- 2855 E Gentile St Unit 1
- 2203 E 1200 N
- 1975 E 1425 N
- 2113 E 1200 N
- 1843 Hayes Dr
- 2569 N 2900 E
- 2340 N 2050 E
- 2273 N 1975 E
Your Personal Tour Guide
Ask me questions while you tour the home.