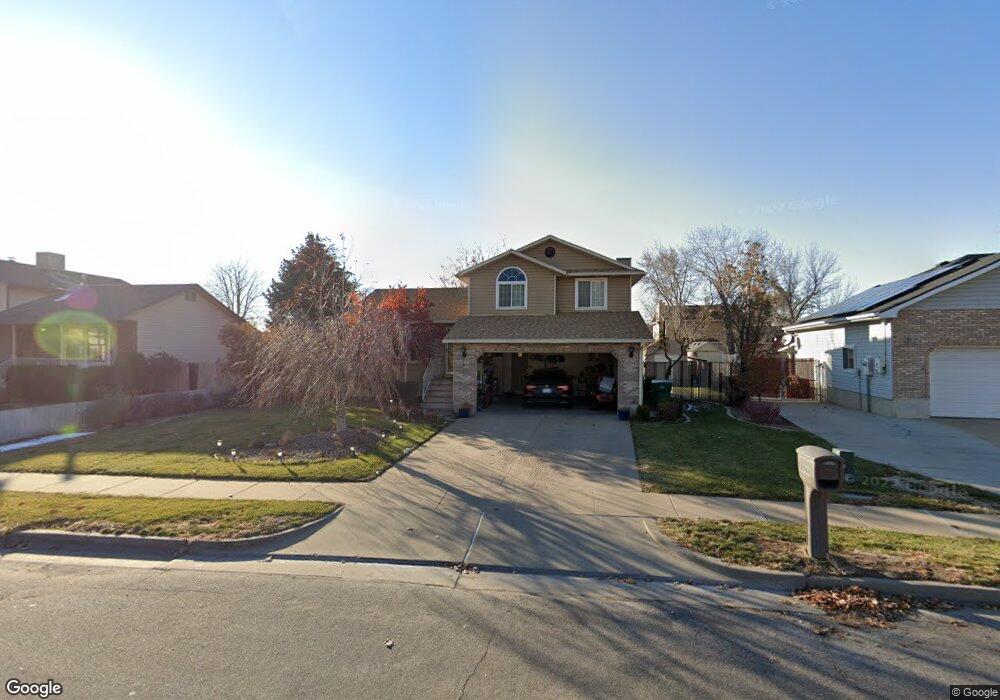
2743 N 1700 E Layton, UT 84040
Estimated Value: $474,292 - $501,000
4
Beds
2
Baths
2,010
Sq Ft
$242/Sq Ft
Est. Value
About This Home
This home is located at 2743 N 1700 E, Layton, UT 84040 and is currently estimated at $485,573, approximately $241 per square foot. 2743 N 1700 E is a home located in Davis County with nearby schools including Mountain View Elementary School, North Layton Junior High School, and Northridge High School.
Ownership History
Date
Name
Owned For
Owner Type
Purchase Details
Closed on
Jun 27, 2016
Sold by
Thompson Christopher S and Thompson Maria
Bought by
Pham Minh and Lam Hoang B
Current Estimated Value
Purchase Details
Closed on
May 28, 2008
Sold by
Widmier Craig A and Widmier Liza R
Bought by
Thompson Christopher S and Thompson Maria
Purchase Details
Closed on
Nov 17, 2000
Sold by
Banz Warren L and Banz Lori M
Bought by
Widmier Craig A and Widmier Liza R
Home Financials for this Owner
Home Financials are based on the most recent Mortgage that was taken out on this home.
Original Mortgage
$133,000
Interest Rate
7.82%
Create a Home Valuation Report for This Property
The Home Valuation Report is an in-depth analysis detailing your home's value as well as a comparison with similar homes in the area
Home Values in the Area
Average Home Value in this Area
Purchase History
| Date | Buyer | Sale Price | Title Company |
|---|---|---|---|
| Pham Minh | -- | First American Title | |
| Thompson Christopher S | -- | Inwest Title Services Inc | |
| Widmier Craig A | -- | Associated Title Company |
Source: Public Records
Mortgage History
| Date | Status | Borrower | Loan Amount |
|---|---|---|---|
| Previous Owner | Widmier Craig A | $133,000 |
Source: Public Records
Tax History
| Year | Tax Paid | Tax Assessment Tax Assessment Total Assessment is a certain percentage of the fair market value that is determined by local assessors to be the total taxable value of land and additions on the property. | Land | Improvement |
|---|---|---|---|---|
| 2025 | $2,491 | $238,700 | $115,227 | $123,473 |
| 2024 | $2,375 | $231,001 | $140,575 | $90,426 |
| 2023 | $2,321 | $402,000 | $193,071 | $208,929 |
| 2022 | $2,402 | $227,700 | $103,250 | $124,450 |
| 2021 | $2,237 | $316,000 | $156,638 | $159,362 |
| 2020 | $1,985 | $268,000 | $124,868 | $143,132 |
| 2019 | $1,944 | $259,000 | $111,967 | $147,033 |
| 2018 | $1,750 | $234,000 | $69,195 | $164,805 |
| 2016 | $897 | $110,000 | $34,630 | $75,370 |
| 2015 | $1,483 | $99,275 | $34,630 | $64,645 |
| 2014 | $376 | $97,778 | $34,630 | $63,148 |
| 2013 | -- | $99,630 | $22,748 | $76,882 |
Source: Public Records
Map
Nearby Homes
- 1731 E 2825 N
- 2826 N 1600 E
- 1785 E 2825 N
- 1911 Deere Valley Dr
- 1935 Deere Valley Dr
- 1447 E 2700 N
- 3142 E Thorley Dr
- 3138 E Thorley Dr
- 1821 E Whitetail Way
- 1827 E Whitetail Dr
- 1444 E 2400 N
- 3176 N 1450 E
- 2340 N 2050 E
- 2273 N 1975 E
- 2189 N 1950 E
- 1241 E 3075 N
- 1321 E 3125 N
- 1266 E 3125 N
- 3232 N Redtail Way
- 2597 N 2300 E
Your Personal Tour Guide
Ask me questions while you tour the home.