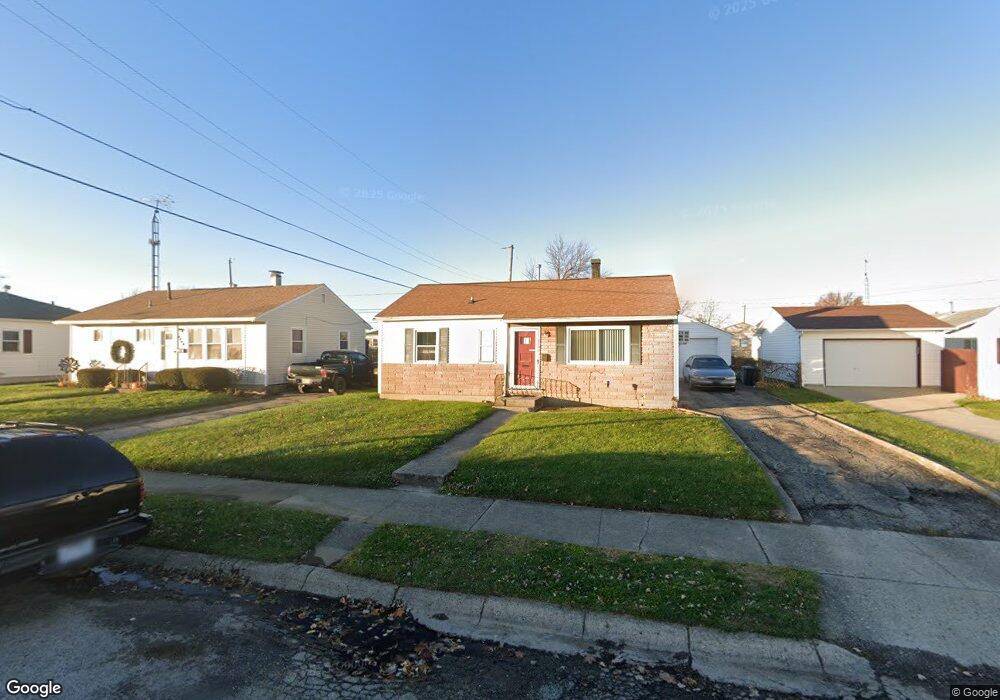
2744 Duncan St Springfield, OH 45505
Estimated Value: $117,000 - $133,000
3
Beds
1
Bath
816
Sq Ft
$154/Sq Ft
Est. Value
About This Home
This home is located at 2744 Duncan St, Springfield, OH 45505 and is currently estimated at $125,582, approximately $153 per square foot. 2744 Duncan St is a home located in Clark County with nearby schools including Mann Elementary School, Schaefer Middle School, and Springfield High School.
Ownership History
Date
Name
Owned For
Owner Type
Purchase Details
Closed on
Jun 6, 2003
Sold by
Mcfarland Colleen S
Bought by
Rowe William J
Current Estimated Value
Purchase Details
Closed on
Sep 11, 2001
Sold by
Perkins Spencer A and Perkins Jonica L
Bought by
Mcfarland Colleen S and Rowe William J
Home Financials for this Owner
Home Financials are based on the most recent Mortgage that was taken out on this home.
Original Mortgage
$59,529
Interest Rate
7.03%
Mortgage Type
FHA
Create a Home Valuation Report for This Property
The Home Valuation Report is an in-depth analysis detailing your home's value as well as a comparison with similar homes in the area
Home Values in the Area
Average Home Value in this Area
Purchase History
| Date | Buyer | Sale Price | Title Company |
|---|---|---|---|
| Rowe William J | -- | -- | |
| Mcfarland Colleen S | $60,000 | -- |
Source: Public Records
Mortgage History
| Date | Status | Borrower | Loan Amount |
|---|---|---|---|
| Previous Owner | Mcfarland Colleen S | $59,529 |
Source: Public Records
Tax History
| Year | Tax Paid | Tax Assessment Tax Assessment Total Assessment is a certain percentage of the fair market value that is determined by local assessors to be the total taxable value of land and additions on the property. | Land | Improvement |
|---|---|---|---|---|
| 2025 | $1,692 | $31,560 | $5,090 | $26,470 |
| 2024 | $1,100 | $22,820 | $4,760 | $18,060 |
| 2023 | $1,100 | $22,820 | $4,760 | $18,060 |
| 2022 | $1,127 | $22,820 | $4,760 | $18,060 |
| 2021 | $801 | $14,980 | $3,270 | $11,710 |
| 2020 | $803 | $14,980 | $3,270 | $11,710 |
| 2019 | $805 | $14,980 | $3,270 | $11,710 |
| 2018 | $838 | $14,990 | $2,730 | $12,260 |
| 2017 | $838 | $16,087 | $2,727 | $13,360 |
| 2016 | $839 | $16,087 | $2,727 | $13,360 |
| 2015 | $1,033 | $15,607 | $2,727 | $12,880 |
| 2014 | $1,029 | $15,607 | $2,727 | $12,880 |
| 2013 | $1,018 | $15,607 | $2,727 | $12,880 |
Source: Public Records
Map
Nearby Homes
- 2670 Duncan St
- 728 Mavor St
- 1011 Mount Joy St
- 2560 Kenton St
- 3012 E High St
- 360 Buxton Ave
- 3154 Sherwood Park Dr
- 374 Raffensperger Ave
- 138 Lawnview Ave
- 262 Raffensperger Ave
- 121 Willis Ave
- 400 S Arlington Ave Unit 402
- 115 S Burnett Rd
- 2702 Maplewood Ave
- 273 S Clairmont Ave
- 2424-2426 E High St
- 535 S Belmont Ave
- 2111 Kenilworth Ave
- 250 S Douglas Ave Unit 254
- 2108 Sunset Ave
- 2738 Duncan St
- 2750 Duncan St
- 733 Mount Joy St
- 2732 Duncan St
- 2743 Elmore Dr
- 2739 Elmore Dr
- 2728 Duncan St
- 727 Mount Joy St
- 2741 Duncan St
- 2745 Duncan St
- 2735 Duncan St
- 2727 Elmore Dr
- 2722 Duncan St
- 2729 Duncan St
- 2804 Duncan St
- 2723 Elmore Dr
- 2723 Duncan St
- 734 Mount Joy St
- 827 Mount Joy St
- 2718 Duncan St
Your Personal Tour Guide
Ask me questions while you tour the home.