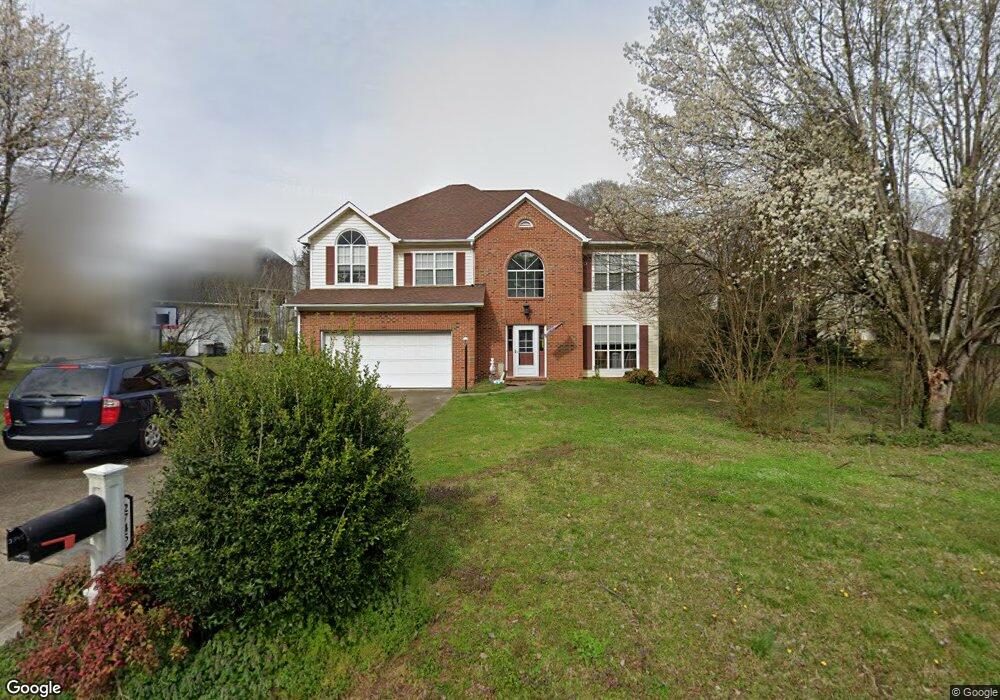
2745 Lamplighter Dr Kannapolis, NC 28081
Estimated Value: $419,222 - $470,000
5
Beds
3
Baths
2,360
Sq Ft
$189/Sq Ft
Est. Value
About This Home
This home is located at 2745 Lamplighter Dr, Kannapolis, NC 28081 and is currently estimated at $446,806, approximately $189 per square foot. 2745 Lamplighter Dr is a home located in Cabarrus County with nearby schools including Winecoff Elementary School, Northwest Cabarrus Middle School, and Northwest Cabarrus High.
Ownership History
Date
Name
Owned For
Owner Type
Purchase Details
Closed on
Aug 31, 2009
Sold by
Price Kenneth W and Price Dwendolyn J
Bought by
Thompson Davis Timothy and Thompson Davis Corey
Current Estimated Value
Home Financials for this Owner
Home Financials are based on the most recent Mortgage that was taken out on this home.
Original Mortgage
$187,933
Interest Rate
4.92%
Mortgage Type
FHA
Purchase Details
Closed on
Jul 9, 1999
Sold by
Petranick Donald W and Petranick Wanda W
Bought by
Price Kenneth W and Price Dwendolyn J
Home Financials for this Owner
Home Financials are based on the most recent Mortgage that was taken out on this home.
Original Mortgage
$151,900
Interest Rate
7.43%
Purchase Details
Closed on
Aug 1, 1992
Bought by
Petranick Donald W
Purchase Details
Closed on
Dec 1, 1991
Create a Home Valuation Report for This Property
The Home Valuation Report is an in-depth analysis detailing your home's value as well as a comparison with similar homes in the area
Home Values in the Area
Average Home Value in this Area
Purchase History
| Date | Buyer | Sale Price | Title Company |
|---|---|---|---|
| Thompson Davis Timothy | $191,500 | None Available | |
| Price Kenneth W | $160,000 | -- | |
| Petranick Donald W | $147,500 | -- | |
| -- | $26,000 | -- |
Source: Public Records
Mortgage History
| Date | Status | Borrower | Loan Amount |
|---|---|---|---|
| Previous Owner | Thompson Davis Timothy | $187,933 | |
| Previous Owner | Price Kenneth W | $151,900 |
Source: Public Records
Tax History
| Year | Tax Paid | Tax Assessment Tax Assessment Total Assessment is a certain percentage of the fair market value that is determined by local assessors to be the total taxable value of land and additions on the property. | Land | Improvement |
|---|---|---|---|---|
| 2025 | $4,304 | $379,060 | $91,000 | $288,060 |
| 2024 | $4,304 | $379,060 | $91,000 | $288,060 |
| 2023 | $3,186 | $232,590 | $50,000 | $182,590 |
| 2022 | $3,186 | $232,590 | $50,000 | $182,590 |
| 2021 | $3,186 | $232,590 | $50,000 | $182,590 |
| 2020 | $3,186 | $232,590 | $50,000 | $182,590 |
| 2019 | $2,447 | $178,580 | $30,000 | $148,580 |
| 2018 | $2,411 | $178,580 | $30,000 | $148,580 |
| 2017 | $2,375 | $178,580 | $30,000 | $148,580 |
| 2016 | $2,375 | $192,550 | $45,000 | $147,550 |
| 2015 | -- | $192,550 | $45,000 | $147,550 |
| 2014 | -- | $192,550 | $45,000 | $147,550 |
Source: Public Records
Map
Nearby Homes
- 2737 Lamplighter Dr
- 2775 Lamplighter Dr
- 1700 Oakwood Ave
- 2645 Watts Ave
- 2605 Lamplighter Dr
- 1933 Stonewyck Ave
- 2609 Lamp Post Ln
- 1561 Forest Glen Ln
- 1318 Ridgewood Dr
- 2073 Hambridge Ave
- 110 Daisy Ave Unit 1
- 2448 Spruce St
- 1383 Hidden Valley Dr
- 2342 Bloomfield Dr
- 626 Flicker St
- 2305 Bloomfield Dr
- 1436 Trotters Ridge Rd
- 2812 Woodwind Ct
- 301 Briarcliff Dr
- 1229 Brecken Ct
- 2753 Lamplighter Dr
- 2757 Lamplighter Dr
- 1615 J Shreffler Ct
- 2740 Lamplighter Dr
- 2744 Lamplighter Dr
- 2733 Lamplighter Dr
- 2736 Lamplighter Dr
- 2748 Lamplighter Dr
- 2732 Lamplighter Dr
- 2752 Lamplighter Dr
- 2319 Coach House Ln
- 2761 Lamplighter Dr
- 1600 J Shreffler Ct
- 2756 Lamplighter Dr
- 2729 Lamplighter Dr
- 2728 Lamplighter Dr
- 2317 Coach House Ln
- 2760 Lamplighter Dr
- 2765 Lamplighter Dr
- 2316 Coach House Ln
Your Personal Tour Guide
Ask me questions while you tour the home.