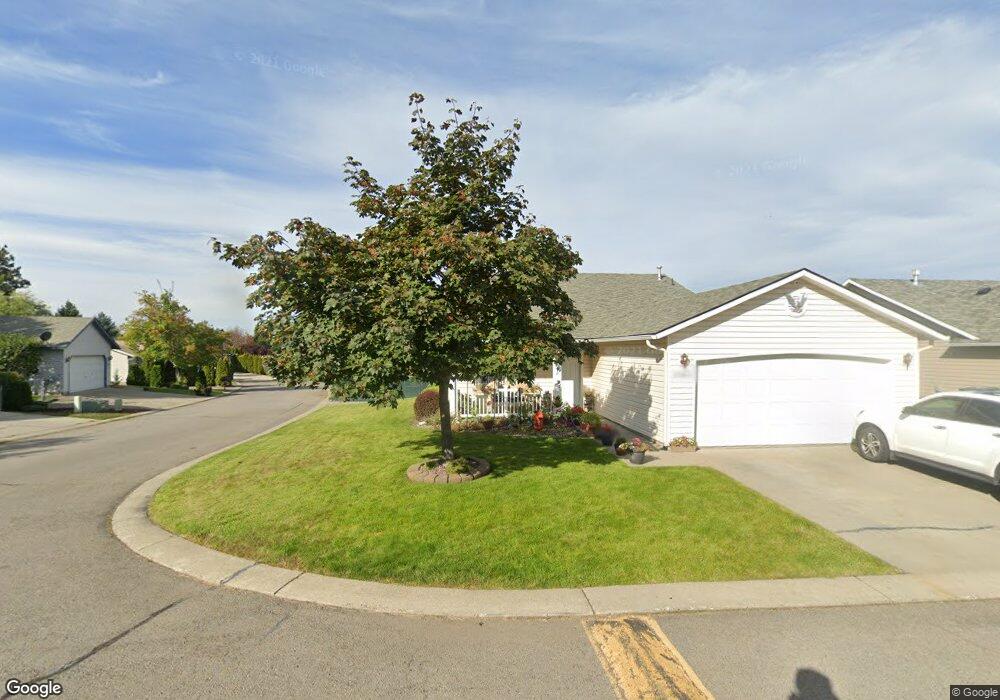
2745 N Wickiup Dr Post Falls, ID 83854
Central Post Falls NeighborhoodEstimated Value: $393,000 - $433,000
3
Beds
2
Baths
1,410
Sq Ft
$297/Sq Ft
Est. Value
About This Home
This home is located at 2745 N Wickiup Dr, Post Falls, ID 83854 and is currently estimated at $418,522, approximately $296 per square foot. 2745 N Wickiup Dr is a home with nearby schools including Mullan Trail Elementary School, River City Middle School, and Post Falls High School.
Ownership History
Date
Name
Owned For
Owner Type
Purchase Details
Closed on
Jun 24, 2016
Sold by
Macdonald Kristie
Bought by
Mitchell Victor W and Mitchell Sharon L
Current Estimated Value
Home Financials for this Owner
Home Financials are based on the most recent Mortgage that was taken out on this home.
Original Mortgage
$5,659
Outstanding Balance
$4,516
Interest Rate
3.57%
Mortgage Type
Stand Alone Second
Estimated Equity
$414,006
Purchase Details
Closed on
Apr 27, 2015
Sold by
Lanktree Maureen
Bought by
The Maureen Lanktree Living Trust
Purchase Details
Closed on
Aug 20, 2007
Sold by
Lanktree Maureen D and Lanktree Kristie
Bought by
Lanktree Maureen
Purchase Details
Closed on
Sep 15, 2005
Sold by
Swarat Davod and Swarat Mary
Bought by
Lanktree Kristie and Lanktree Maureen Dane
Home Financials for this Owner
Home Financials are based on the most recent Mortgage that was taken out on this home.
Original Mortgage
$27,700
Interest Rate
5.32%
Mortgage Type
Credit Line Revolving
Create a Home Valuation Report for This Property
The Home Valuation Report is an in-depth analysis detailing your home's value as well as a comparison with similar homes in the area
Home Values in the Area
Average Home Value in this Area
Purchase History
| Date | Buyer | Sale Price | Title Company |
|---|---|---|---|
| Mitchell Victor W | -- | Kootenai County Title Co | |
| The Maureen Lanktree Living Trust | -- | None Available | |
| Lanktree Maureen | -- | -- | |
| Lanktree Kristie | -- | -- |
Source: Public Records
Mortgage History
| Date | Status | Borrower | Loan Amount |
|---|---|---|---|
| Open | Mitchell Victor W | $5,659 | |
| Open | Mitchell Victor W | $158,770 | |
| Previous Owner | Lanktree Kristie | $27,700 | |
| Previous Owner | Lanktree Kristie | $148,000 |
Source: Public Records
Tax History Compared to Growth
Tax History
| Year | Tax Paid | Tax Assessment Tax Assessment Total Assessment is a certain percentage of the fair market value that is determined by local assessors to be the total taxable value of land and additions on the property. | Land | Improvement |
|---|---|---|---|---|
| 2024 | $1,393 | $370,150 | $132,000 | $238,150 |
| 2023 | $1,393 | $396,005 | $165,000 | $231,005 |
| 2022 | $1,932 | $434,110 | $165,000 | $269,110 |
| 2021 | $1,672 | $286,700 | $110,000 | $176,700 |
| 2020 | $1,572 | $234,170 | $80,000 | $154,170 |
| 2019 | $1,355 | $203,390 | $85,000 | $118,390 |
| 2018 | $1,326 | $182,980 | $75,000 | $107,980 |
| 2017 | $1,272 | $160,420 | $55,000 | $105,420 |
| 2016 | $2,353 | $146,040 | $45,000 | $101,040 |
| 2015 | $2,285 | $139,430 | $38,000 | $101,430 |
| 2013 | $2,139 | $120,560 | $29,000 | $91,560 |
Source: Public Records
Map
Nearby Homes
- 2640 N Wickiup Dr
- 3160 Treaty Rock Blvd
- 2875 N Rawhide Ridge Rd
- 2441 N Henry St
- 3292 N Fireball Ct
- 2815 N Slice Dr
- 3397 Blaze Loop
- 308 E 22nd Ave
- 2431 N Rawhide Ridge Rd
- 3491 Blaze Loop
- Blaze LP Lt2blk1lt 3 10 11 12 13 14blk2
- 3494 N Blaze Loop
- 3509 Blaze Loop
- 2680 N Top Flight Dr
- 3636 N Blaze Loop
- 3510 N Blaze Loop
- 3526 N Blaze Loop
- 2212 N Columbine Ct
- 3523 N Blaze Loop
- 0 N Lt 2 Blk 1 Blaze Loop
- 2765 N Wickiup Dr
- 2740 N Cochise St
- 2734 Cochise St
- 2760 N Cochise St
- 200 W Pawnee Dr
- 2760 N Wickiup Dr
- 2740 N Wickiup Dr
- 2785 N Wickiup Dr
- 220 W Pawnee Dr
- 2780 N Wickiup Dr
- 2780 N Cochise St
- 2720 N Wickiup Dr
- 240 W Pawnee Dr
- 2820 Cochise St
- 2815 N Wickiup Dr
- 205 W Chippewa Dr
- 2745 N Cochise St
- 2800 N Wickiup Dr
- 2515 N Sharon Dr
- 2735 Cochise St