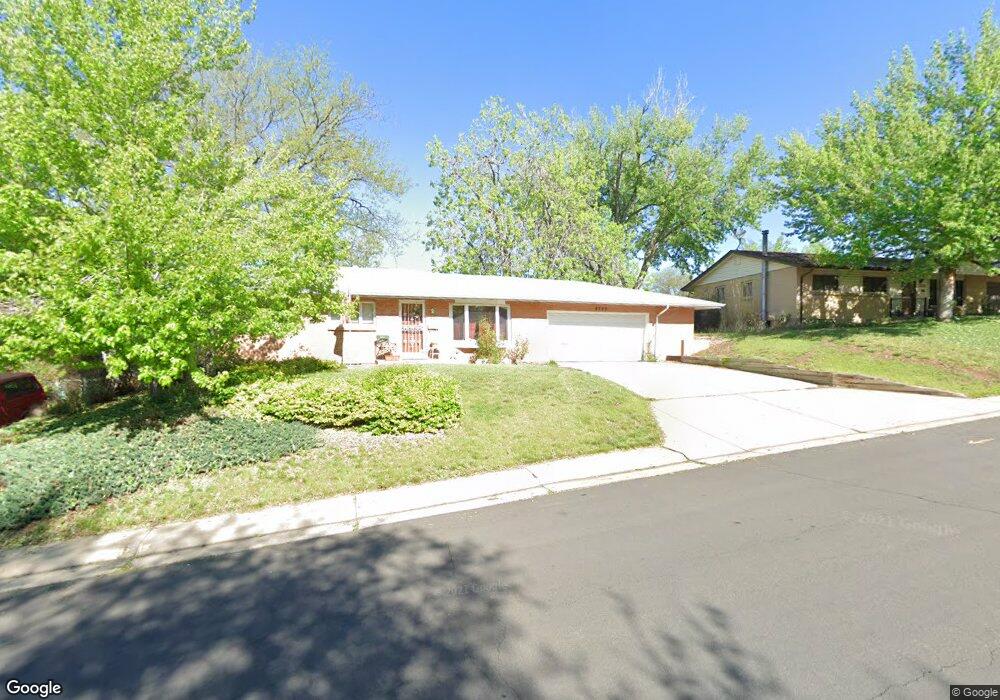
2745 S Zurich Ct Denver, CO 80236
Southwest Denver NeighborhoodEstimated Value: $522,000 - $546,000
3
Beds
2
Baths
2,090
Sq Ft
$255/Sq Ft
Est. Value
About This Home
This home is located at 2745 S Zurich Ct, Denver, CO 80236 and is currently estimated at $531,916, approximately $254 per square foot. 2745 S Zurich Ct is a home located in Denver County with nearby schools including Bear Valley International School, John F Kennedy High School, and Excel Academy.
Ownership History
Date
Name
Owned For
Owner Type
Purchase Details
Closed on
Sep 4, 2021
Sold by
Engen Blythe R and Engen Kip D
Bought by
Reimers Brendan and Reimers Paul
Current Estimated Value
Home Financials for this Owner
Home Financials are based on the most recent Mortgage that was taken out on this home.
Original Mortgage
$392,000
Outstanding Balance
$356,691
Interest Rate
2.8%
Mortgage Type
New Conventional
Estimated Equity
$175,225
Purchase Details
Closed on
Nov 29, 2012
Sold by
Palmer Shirley M
Bought by
The Shirley M Palmer Trust
Purchase Details
Closed on
Nov 17, 2006
Sold by
Bodemann Virginia A
Bought by
Palmer Shirley M
Home Financials for this Owner
Home Financials are based on the most recent Mortgage that was taken out on this home.
Original Mortgage
$121,600
Interest Rate
6.37%
Mortgage Type
Purchase Money Mortgage
Create a Home Valuation Report for This Property
The Home Valuation Report is an in-depth analysis detailing your home's value as well as a comparison with similar homes in the area
Home Values in the Area
Average Home Value in this Area
Purchase History
| Date | Buyer | Sale Price | Title Company |
|---|---|---|---|
| Reimers Brendan | $490,000 | None Available | |
| The Shirley M Palmer Trust | -- | None Available | |
| Palmer Shirley M | $220,000 | Chicago Title Co | |
| Liszak Joseph M | $152,000 | Chicago Title Co |
Source: Public Records
Mortgage History
| Date | Status | Borrower | Loan Amount |
|---|---|---|---|
| Open | Reimers Brendan | $392,000 | |
| Previous Owner | Liszak Joseph M | $121,600 | |
| Previous Owner | Palmer Shirley M | $176,000 |
Source: Public Records
Tax History Compared to Growth
Tax History
| Year | Tax Paid | Tax Assessment Tax Assessment Total Assessment is a certain percentage of the fair market value that is determined by local assessors to be the total taxable value of land and additions on the property. | Land | Improvement |
|---|---|---|---|---|
| 2024 | $2,730 | $34,470 | $7,480 | $26,990 |
| 2023 | $2,671 | $34,470 | $7,480 | $26,990 |
| 2022 | $2,278 | $28,650 | $11,590 | $17,060 |
| 2021 | $2,278 | $29,470 | $11,920 | $17,550 |
| 2020 | $2,092 | $28,200 | $11,180 | $17,020 |
| 2019 | $2,034 | $28,200 | $11,180 | $17,020 |
| 2018 | $1,773 | $22,920 | $9,760 | $13,160 |
| 2017 | $1,768 | $22,920 | $9,760 | $13,160 |
| 2016 | $1,544 | $18,930 | $6,639 | $12,291 |
| 2015 | $1,479 | $18,930 | $6,639 | $12,291 |
| 2014 | $1,360 | $16,370 | $3,709 | $12,661 |
Source: Public Records
Map
Nearby Homes
- 2650 S Sheridan Ct Unit 2
- 2867 S Sheridan Blvd
- 2861 S Yates St
- 2630 S Wolff Way
- 5611 W Bates Ave
- 2782 S Fenton St
- 2733 S Vrain St
- 2939 S Zurich Ct
- 2959 S Depew St
- 5661 W Lakeridge Rd
- 2595 S Harlan Ct
- 2864 S Raleigh St
- 3014 S Zurich Ct
- 5337 W Iliff Dr Unit 105
- 5317 W Iliff Dr Unit 101
- 2646 S Stuart Way
- 2545 S Tennyson Way
- 2529 S Utica St
- 2548 S Tennyson Way
- 2862 S Ivan Way
- 2735 S Zurich Ct
- 2755 S Zurich Ct
- 2746 S Sheridan Blvd
- 2736 S Sheridan Blvd
- 2744 S Zurich Ct
- 2725 S Zurich Ct
- 2765 S Zurich Ct
- 2754 S Zurich Ct
- 2726 S Sheridan Blvd
- 2756 S Sheridan Blvd
- 2734 S Zurich Ct
- 2764 S Zurich Ct
- 2766 S Sheridan Blvd
- 2715 S Zurich Ct
- 2724 S Zurich Ct
- 2716 S Sheridan Blvd
- 2775 S Zurich Ct
- 2753 S Zenobia St
- 2714 S Zurich Ct
- 2774 S Zurich Ct