
Seller's Agent in 2026
Geri Doyle
RE/MAX Results
(641) 521-5678
1 in this area
89 Total Sales
Estimated Value: $156,000 - $166,552
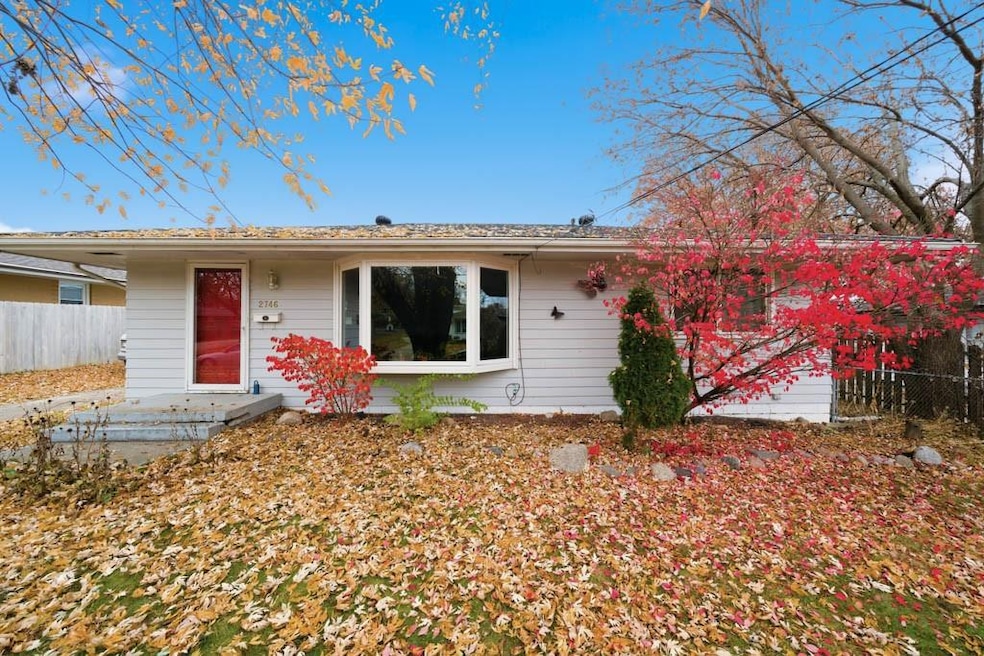
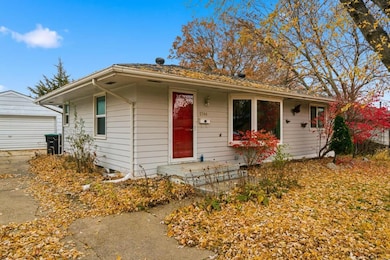
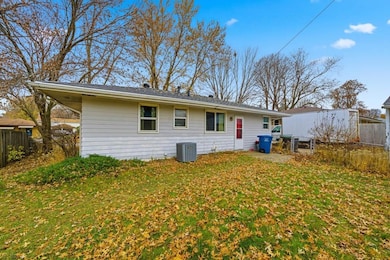
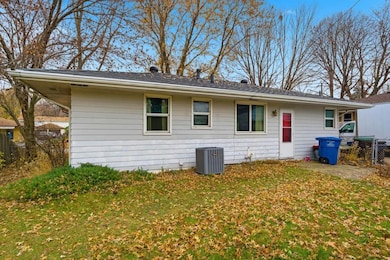
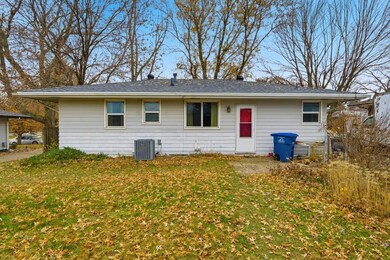
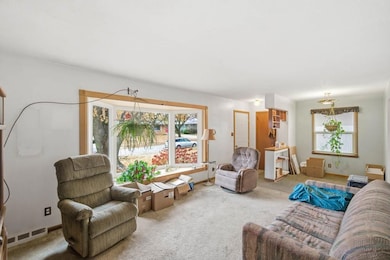
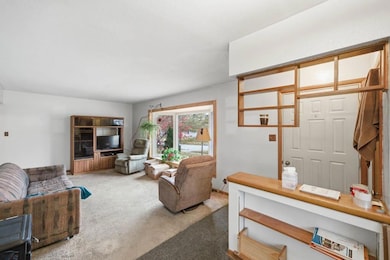
Fantastic opportunity in DesMoines. Gain instant equity in this home. Newer windows, roof, Hvac/CA, water heater
Great location. Don't miss out!
We collect this data history from publicly available records. To have your information removed, we recommend requesting removal directly through your county’s website.
We collect this data history from publicly available records. To have your information removed, we recommend requesting removal directly through your county’s website.
| Date | Buyer | Sale Price | Title Company |
|---|---|---|---|
| $235,500 | None Listed On Document | ||
| $160,000 | None Listed On Document |
We collect this data history from publicly available records. To have your information removed, we recommend requesting removal directly through your county’s website.
| Date | Status | Borrower | Loan Amount |
|---|---|---|---|
| Open | $176,250 |
We collect this data history from publicly available records. To have your information removed, we recommend requesting removal directly through your county’s website.
| Date | Event | Price | List to Sale | Price per Sq Ft |
|---|---|---|---|---|
| 01/05/2026 01/05/26 | Sold | $160,000 | 0.0% | $175 / Sq Ft |
| 11/29/2025 11/29/25 | Pending | -- | -- | -- |
| 11/24/2025 11/24/25 | For Sale | $160,000 | -- | $175 / Sq Ft |
We collect this data history from publicly available records. To have your information removed, we recommend requesting removal directly through your county’s website.
| Year | Tax Paid | Tax Assessment Tax Assessment Total Assessment is a certain percentage of the fair market value that is determined by local assessors to be the total taxable value of land and additions on the property. | Land | Improvement |
|---|---|---|---|---|
| 2025 | $2,716 | $161,300 | $36,600 | $124,700 |
| 2024 | $2,656 | $145,500 | $32,600 | $112,900 |
| 2023 | $2,798 | $145,500 | $32,600 | $112,900 |
| 2022 | $2,774 | $127,600 | $29,100 | $98,500 |
| 2021 | $2,688 | $127,600 | $29,100 | $98,500 |
| 2020 | $2,786 | $116,300 | $26,400 | $89,900 |
| 2019 | $2,504 | $116,300 | $26,400 | $89,900 |
| 2018 | $2,474 | $101,700 | $22,600 | $79,100 |
| 2017 | $2,310 | $101,700 | $22,600 | $79,100 |
| 2016 | $2,244 | $93,900 | $20,600 | $73,300 |
| 2015 | $2,244 | $93,900 | $20,600 | $73,300 |
| 2014 | $2,186 | $94,300 | $20,300 | $74,000 |
Seller's Agent in 2026
Geri Doyle
RE/MAX Results
(641) 521-5678
1 in this area
89 Total Sales
Source: Des Moines Area Association of REALTORS®
MLS Number: 730850
APN: 060-03403010000
Disclaimer: Certain information contained herein is derived from information provided by parties other than Homes.com. All information provided is deemed reliable, but is not guaranteed to be accurate and should be independently verified.
![]() IDX information is provided exclusively for personal, non-commercial use, and may not be used for any purpose other than to identify prospective properties consumers may be interested in purchasing. Information is deemed reliable but not guaranteed.
IDX information is provided exclusively for personal, non-commercial use, and may not be used for any purpose other than to identify prospective properties consumers may be interested in purchasing. Information is deemed reliable but not guaranteed.
Ask me questions while you tour the home.