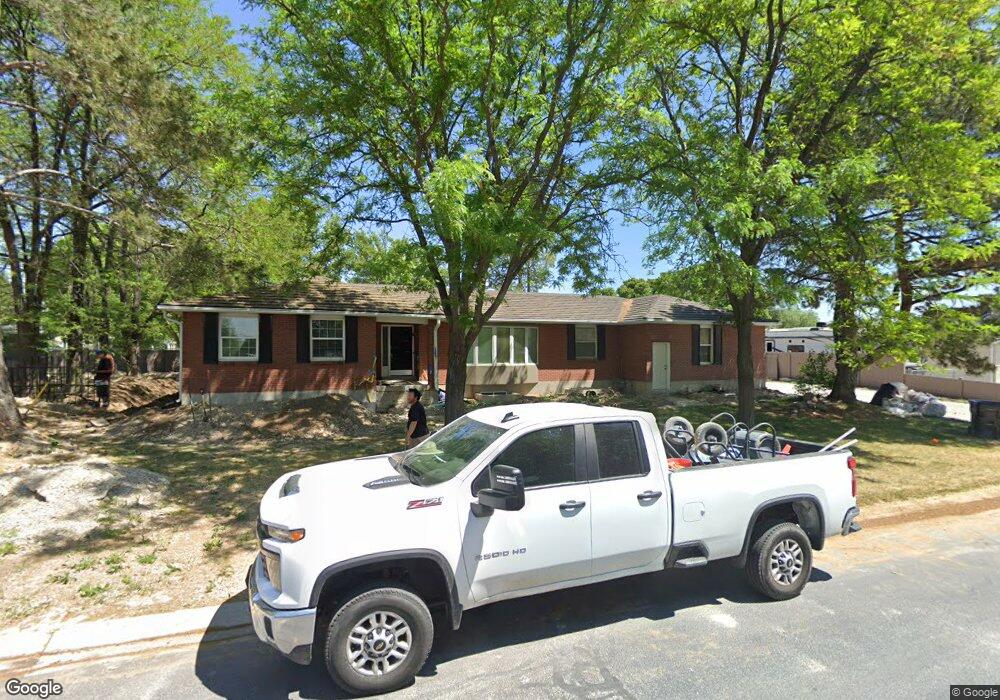
2746 W 6680 S West Jordan, UT 84084
Estimated Value: $873,000 - $993,079
6
Beds
4
Baths
5,096
Sq Ft
$178/Sq Ft
Est. Value
About This Home
This home is located at 2746 W 6680 S, West Jordan, UT 84084 and is currently estimated at $906,770, approximately $177 per square foot. 2746 W 6680 S is a home located in Salt Lake County with nearby schools including West Jordan Middle School, West Jordan High School, and Learning Tree School - Southwest.
Ownership History
Date
Name
Owned For
Owner Type
Purchase Details
Closed on
Nov 20, 2023
Sold by
Hickenlooper Neal G
Bought by
Neal G Hickenlooper Living Trust and Hickenlooper
Current Estimated Value
Home Financials for this Owner
Home Financials are based on the most recent Mortgage that was taken out on this home.
Original Mortgage
$679,920
Outstanding Balance
$628,854
Interest Rate
6.78%
Mortgage Type
New Conventional
Estimated Equity
$277,916
Create a Home Valuation Report for This Property
The Home Valuation Report is an in-depth analysis detailing your home's value as well as a comparison with similar homes in the area
Home Values in the Area
Average Home Value in this Area
Purchase History
| Date | Buyer | Sale Price | Title Company |
|---|---|---|---|
| Neal G Hickenlooper Living Trust | -- | Highland Title | |
| Hickenlooper Neal G | -- | Northern Title Company |
Source: Public Records
Mortgage History
| Date | Status | Borrower | Loan Amount |
|---|---|---|---|
| Open | Hickenlooper Neal G | $679,920 |
Source: Public Records
Tax History Compared to Growth
Tax History
| Year | Tax Paid | Tax Assessment Tax Assessment Total Assessment is a certain percentage of the fair market value that is determined by local assessors to be the total taxable value of land and additions on the property. | Land | Improvement |
|---|---|---|---|---|
| 2025 | $4,331 | $917,500 | $248,600 | $668,900 |
| 2024 | $4,331 | $852,400 | $239,000 | $613,400 |
| 2023 | $4,005 | $708,200 | $236,700 | $471,500 |
| 2022 | $4,005 | $714,500 | $232,100 | $482,400 |
| 2021 | $3,210 | $526,600 | $193,400 | $333,200 |
| 2020 | $3,283 | $501,900 | $193,400 | $308,500 |
| 2019 | $3,223 | $481,700 | $162,400 | $319,300 |
| 2018 | $2,895 | $429,100 | $151,300 | $277,800 |
| 2017 | $2,719 | $401,300 | $151,300 | $250,000 |
| 2016 | $2,769 | $383,900 | $151,300 | $232,600 |
| 2015 | $2,238 | $302,600 | $154,100 | $148,500 |
| 2014 | $2,020 | $268,900 | $139,700 | $129,200 |
Source: Public Records
Map
Nearby Homes
- 2683 W Carson Ln
- 6512 Timpanogos Way
- 6918 S Harvest Cir
- 6453 Fremont Peak Cir
- 2421 W 6900 S
- 2333 W Ledgewood Dr
- 8524 S Michele River Ave W Unit 109
- 3052 W Matterhorn Dr
- 2332 Broderick Dr
- 6893 S 3200 W
- 3226 Tysonbrook Ct
- 6672 S 3335 W
- 6924 S 2160 W
- 3305 W Kingsbrook Ave
- 1824 W 6200 S
- 2342 W 6200 S
- 2312 W Hidden Bend Cove Unit 107
- 3383 W 6880 S
- 6095 S Sierra Grande Dr
- 2126 W Happiness Dr