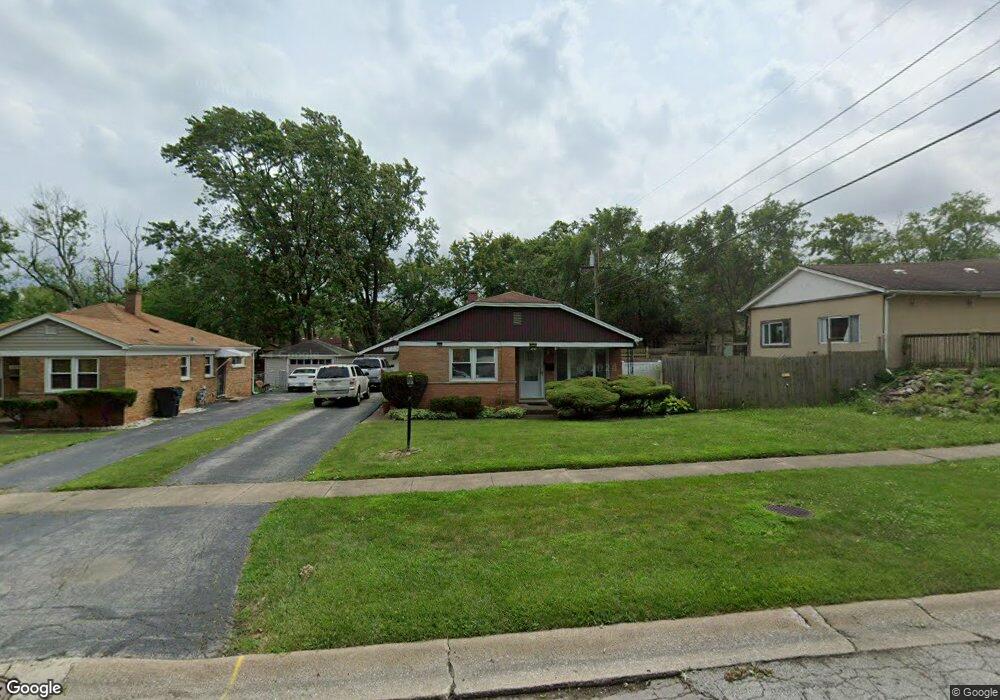
2747 Tennyson Place Hazel Crest, IL 60429
Estimated Value: $167,000 - $196,000
3
Beds
1
Bath
1,287
Sq Ft
$142/Sq Ft
Est. Value
About This Home
This home is located at 2747 Tennyson Place, Hazel Crest, IL 60429 and is currently estimated at $182,628, approximately $141 per square foot. 2747 Tennyson Place is a home located in Cook County with nearby schools including Hillcrest High School.
Ownership History
Date
Name
Owned For
Owner Type
Purchase Details
Closed on
Oct 18, 2010
Sold by
Johnson Antoine L
Bought by
Fykes Gloria J and Fykes Arthur L
Current Estimated Value
Home Financials for this Owner
Home Financials are based on the most recent Mortgage that was taken out on this home.
Original Mortgage
$82,883
Outstanding Balance
$54,750
Interest Rate
4.37%
Mortgage Type
FHA
Estimated Equity
$127,878
Purchase Details
Closed on
Jan 29, 2010
Sold by
Hsbc Bank Usa National Association
Bought by
Johnson Antoine L
Purchase Details
Closed on
Oct 22, 2009
Sold by
Cook Darnell
Bought by
Hsbc Bank Usa National Association
Purchase Details
Closed on
Jul 22, 2005
Sold by
Hogan James D and Hogan Carole A
Bought by
Cook Darnell
Home Financials for this Owner
Home Financials are based on the most recent Mortgage that was taken out on this home.
Original Mortgage
$93,600
Interest Rate
7.5%
Mortgage Type
Unknown
Create a Home Valuation Report for This Property
The Home Valuation Report is an in-depth analysis detailing your home's value as well as a comparison with similar homes in the area
Home Values in the Area
Average Home Value in this Area
Purchase History
| Date | Buyer | Sale Price | Title Company |
|---|---|---|---|
| Fykes Gloria J | $84,000 | Citywide Title Corporation | |
| Johnson Antoine L | $30,000 | Attorneys Title Guaranty Fun | |
| Hsbc Bank Usa National Association | -- | None Available | |
| Cook Darnell | $117,000 | Cti |
Source: Public Records
Mortgage History
| Date | Status | Borrower | Loan Amount |
|---|---|---|---|
| Open | Fykes Gloria J | $82,883 | |
| Previous Owner | Cook Darnell | $93,600 |
Source: Public Records
Tax History Compared to Growth
Tax History
| Year | Tax Paid | Tax Assessment Tax Assessment Total Assessment is a certain percentage of the fair market value that is determined by local assessors to be the total taxable value of land and additions on the property. | Land | Improvement |
|---|---|---|---|---|
| 2024 | $4,497 | $14,000 | $2,161 | $11,839 |
| 2023 | $1,947 | $14,000 | $2,161 | $11,839 |
| 2022 | $1,947 | $8,691 | $1,829 | $6,862 |
| 2021 | $2,026 | $8,690 | $1,828 | $6,862 |
| 2020 | $2,198 | $8,690 | $1,828 | $6,862 |
| 2019 | $1,389 | $8,172 | $1,662 | $6,510 |
| 2018 | $889 | $8,172 | $1,662 | $6,510 |
| 2017 | $1,397 | $8,172 | $1,662 | $6,510 |
| 2016 | $2,053 | $7,587 | $1,496 | $6,091 |
| 2015 | $1,862 | $7,587 | $1,496 | $6,091 |
| 2014 | $1,915 | $7,587 | $1,496 | $6,091 |
| 2013 | $2,959 | $8,064 | $1,496 | $6,568 |
Source: Public Records
Map
Nearby Homes
- 2818 Tennyson Place
- 2810 Lexington Dr
- 2814 Lexington Dr
- 2900 175th St
- 17504 Danielle Ct
- 3003 Longfellow Ave
- 2612 175th St
- 2912 175th St
- 17107 California Ave
- 3004 Longfellow Ave
- 17107 Longfellow Ave
- 17410 Emerson Ave
- 2711 Larkspur Ln
- 2722 Cherrywood Ln
- 3107 Longfellow Ave
- 17405 Longfellow Ave
- 17613 Grandview Dr
- 7 E Carriageway Dr Unit 311
- 2612 Turtle Creek Dr
- 2805 Knollwood Place
- 2741 Tennyson Place
- 17341 California Ave
- 2753 Tennyson Place
- 2737 Tennyson Place
- 17345 California Ave
- 2746 174th St
- 17351 California Ave
- 2740 174th St
- 2731 Tennyson Place
- 2752 Tennyson Place
- 2752 174th St
- 2732 174th St
- 2725 Tennyson Place
- 2746 Tennyson Place
- 2740 Tennyson Place
- 2736 Tennyson Place
- 17317 California Ave
- 2730 Tennyson Place
- 2801 Tennyson Place
- 17350 Mahoney Pkwy