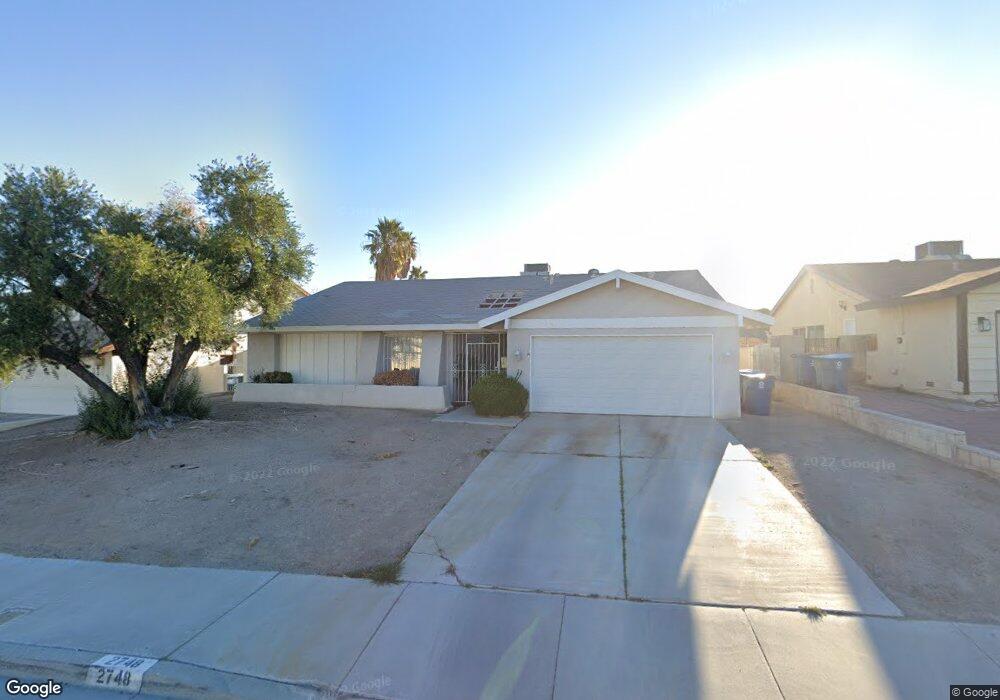
2748 Topaz Ct Las Vegas, NV 89121
Estimated Value: $394,639 - $430,000
4
Beds
2
Baths
1,817
Sq Ft
$228/Sq Ft
Est. Value
About This Home
This home is located at 2748 Topaz Ct, Las Vegas, NV 89121 and is currently estimated at $414,910, approximately $228 per square foot. 2748 Topaz Ct is a home located in Clark County with nearby schools including Will Beckley Elementary School, Knudson Academy of the Arts, and Valley High School.
Ownership History
Date
Name
Owned For
Owner Type
Purchase Details
Closed on
Nov 24, 2003
Sold by
Smith Margo Ayn
Bought by
Sandoval Mauricio A
Current Estimated Value
Home Financials for this Owner
Home Financials are based on the most recent Mortgage that was taken out on this home.
Original Mortgage
$138,400
Outstanding Balance
$66,912
Interest Rate
6.62%
Mortgage Type
Unknown
Estimated Equity
$347,998
Purchase Details
Closed on
Nov 1, 2003
Sold by
Sandoval Clara L
Bought by
Sandoval Mauricio A
Home Financials for this Owner
Home Financials are based on the most recent Mortgage that was taken out on this home.
Original Mortgage
$138,400
Outstanding Balance
$66,912
Interest Rate
6.62%
Mortgage Type
Unknown
Estimated Equity
$347,998
Purchase Details
Closed on
Dec 22, 2000
Sold by
Smith Margo Ayn
Bought by
Smith Margo Ayn and Margo Ayn Smith 1996 Trust
Create a Home Valuation Report for This Property
The Home Valuation Report is an in-depth analysis detailing your home's value as well as a comparison with similar homes in the area
Home Values in the Area
Average Home Value in this Area
Purchase History
| Date | Buyer | Sale Price | Title Company |
|---|---|---|---|
| Sandoval Mauricio A | $173,000 | Ticor Title Of Nevada Inc | |
| Sandoval Mauricio A | -- | Ticor Title Of Nevada Inc | |
| Smith Margo Ayn | -- | -- | |
| Smith Margo Ayn | -- | -- |
Source: Public Records
Mortgage History
| Date | Status | Borrower | Loan Amount |
|---|---|---|---|
| Open | Sandoval Mauricio A | $138,400 | |
| Closed | Sandoval Mauricio A | $34,600 |
Source: Public Records
Tax History Compared to Growth
Tax History
| Year | Tax Paid | Tax Assessment Tax Assessment Total Assessment is a certain percentage of the fair market value that is determined by local assessors to be the total taxable value of land and additions on the property. | Land | Improvement |
|---|---|---|---|---|
| 2025 | $1,318 | $54,941 | $28,000 | $26,941 |
| 2024 | $1,221 | $54,941 | $28,000 | $26,941 |
| 2023 | $1,221 | $57,544 | $33,250 | $24,294 |
| 2022 | $1,131 | $49,727 | $28,000 | $21,727 |
| 2021 | $1,047 | $45,596 | $24,150 | $21,446 |
| 2020 | $969 | $46,141 | $24,150 | $21,991 |
| 2019 | $908 | $41,960 | $19,600 | $22,360 |
| 2018 | $867 | $39,242 | $17,150 | $22,092 |
| 2017 | $1,126 | $38,398 | $15,400 | $22,998 |
| 2016 | $813 | $33,287 | $9,100 | $24,187 |
| 2015 | $810 | $33,546 | $9,100 | $24,446 |
| 2014 | $785 | $25,956 | $6,300 | $19,656 |
Source: Public Records
Map
Nearby Homes
- 2680 Karen Ave
- 2909 Pacific Ave
- 2657 Kline Cir
- 2659 Vegas Valley Dr
- 2471 Old Forge Ln Unit 105
- 2856 Klinger Cir
- 2460 Old Forge Ln Unit 48
- 2430 Old Forge Ln Unit 106
- 3030 Liberty Cir N
- 2420 Old Forge Ln Unit 104
- 2432 Palma Vista Ave
- 0 Robar St Unit 2718009
- 2491 Capistrano Ave
- 3056 Phoenix St
- 3080 Garnet Ct
- 2346 Capistrano Ave
- 2764 Heritage Ct
- 2635 Heritage Ct
- 3168 S Eastern Ave Unit 45
- 2825 Burnham Ave
- 2758 Topaz Ct
- 2738 Topaz Ct
- 2749 Baltic Cir
- 2739 Baltic Cir
- 2759 Baltic Cir
- 2749 Topaz Ct
- 2728 Topaz Ct
- 2759 Topaz Ct
- 2729 Baltic Cir
- 2718 Topaz Ct
- 2639 Pacific Ave
- 2679 Pacific Ave
- 2729 Topaz Ct
- 2599 Pacific Ave
- 2719 Pacific Ave
- 2718 Baltic Cir
- 2748 Baltic Cir
- 2748 Polar Ct
- 2738 Polar Ct
- 2758 Polar Ct