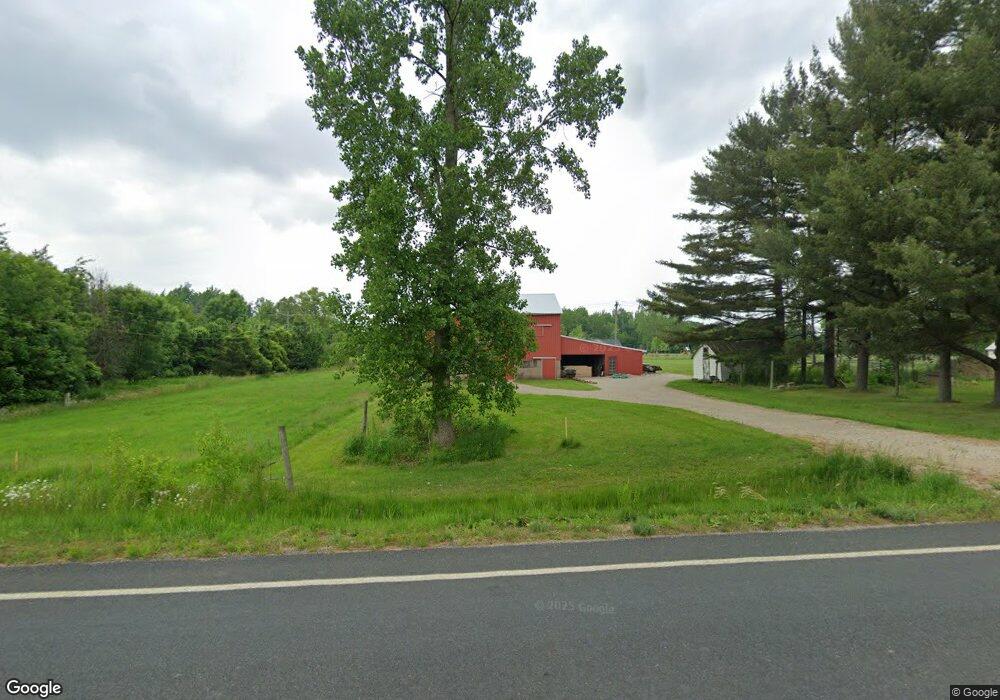
275 133rd Ave Wayland, MI 49348
Estimated Value: $180,001 - $575,000
3
Beds
2
Baths
1,690
Sq Ft
$184/Sq Ft
Est. Value
About This Home
This home is located at 275 133rd Ave, Wayland, MI 49348 and is currently estimated at $311,250, approximately $184 per square foot. 275 133rd Ave is a home located in Allegan County with nearby schools including Wayland High School.
Ownership History
Date
Name
Owned For
Owner Type
Purchase Details
Closed on
Jul 20, 2023
Sold by
Post Randall S and Post Audrey J
Bought by
Holden Sidney T
Current Estimated Value
Purchase Details
Closed on
Sep 13, 2021
Sold by
Post Randall S and Post Audrey J
Bought by
Vanvugt Sherry L and Post Randall S
Purchase Details
Closed on
Sep 10, 2021
Sold by
Post Randall S
Bought by
Post Randall S and Post Audrey J
Purchase Details
Closed on
Oct 17, 2013
Sold by
Post Randall S and Post Audrey
Bought by
Post Randall S
Home Financials for this Owner
Home Financials are based on the most recent Mortgage that was taken out on this home.
Original Mortgage
$103,200
Interest Rate
4.59%
Mortgage Type
New Conventional
Purchase Details
Closed on
Mar 27, 2000
Sold by
Fritts Richard and Fritts Kathleen
Bought by
Post Randall
Create a Home Valuation Report for This Property
The Home Valuation Report is an in-depth analysis detailing your home's value as well as a comparison with similar homes in the area
Home Values in the Area
Average Home Value in this Area
Purchase History
| Date | Buyer | Sale Price | Title Company |
|---|---|---|---|
| Holden Sidney T | $160,000 | West Edge Title | |
| Vanvugt Sherry L | -- | None Available | |
| Post Randall S | -- | None Available | |
| Post Randall S | -- | Lsi | |
| Post Randall | $124,900 | -- |
Source: Public Records
Mortgage History
| Date | Status | Borrower | Loan Amount |
|---|---|---|---|
| Previous Owner | Post Randall S | $103,200 |
Source: Public Records
Tax History Compared to Growth
Tax History
| Year | Tax Paid | Tax Assessment Tax Assessment Total Assessment is a certain percentage of the fair market value that is determined by local assessors to be the total taxable value of land and additions on the property. | Land | Improvement |
|---|---|---|---|---|
| 2025 | $3,163 | $72,500 | $39,900 | $32,600 |
| 2024 | $1,645 | $65,800 | $39,000 | $26,800 |
| 2023 | $1,690 | $94,800 | $37,500 | $57,300 |
| 2022 | $1,645 | $77,000 | $21,100 | $55,900 |
| 2021 | $1,562 | $73,500 | $21,100 | $52,400 |
| 2020 | $1,521 | $75,100 | $19,200 | $55,900 |
| 2019 | $1,479 | $63,300 | $19,200 | $44,100 |
| 2018 | $1,449 | $61,300 | $23,400 | $37,900 |
| 2017 | $0 | $62,600 | $23,400 | $39,200 |
| 2016 | $0 | $58,800 | $22,500 | $36,300 |
| 2015 | -- | $58,800 | $22,500 | $36,300 |
| 2014 | -- | $52,300 | $22,500 | $29,800 |
| 2013 | -- | $48,100 | $22,500 | $25,600 |
Source: Public Records
Map
Nearby Homes
- 516 131st Ave
- 12720 S Grey Ct
- 12857 Michael Dr Unit 49
- 1164 E Bernie Ct
- 1391 Shadowridge Dr
- 3214 7th St
- 590 129th Ave
- 619 137th Ave
- 3296 Stonehill Ct
- 3282 Stonehill Ct
- 843 Wild Flower Ct
- 12031 Sandstone Dr
- 835 Wild Flower Ct
- 12169 Pine Meadows Dr
- 11753 Rosemary Ln
- 11751 Rosemary Ln
- 330 Lotz Ct
- 401 Anderson Dr
- 2841 Odawa Trail
- 2724 Pasture Ln
- 300 133rd Ave
- 229 Deer View Rd
- 297 133rd Ave
- 260 133rd Ave
- 255 133rd Ave
- 307 133rd Ave
- 239 Deer View Rd
- 280 Deer View Rd
- 240 133rd Ave
- 275 Deer View Rd
- 249 Deer View Rd
- 300 Deer View Rd
- 279 Deer View Rd
- 350 133rd Ave
- 287 Deer View Rd
- 299 Deer View Rd
- 355 133rd Ave
- 355 133rd Ave Unit PAR 2
- 231 Deer View Rd
- 385 133rd Ave