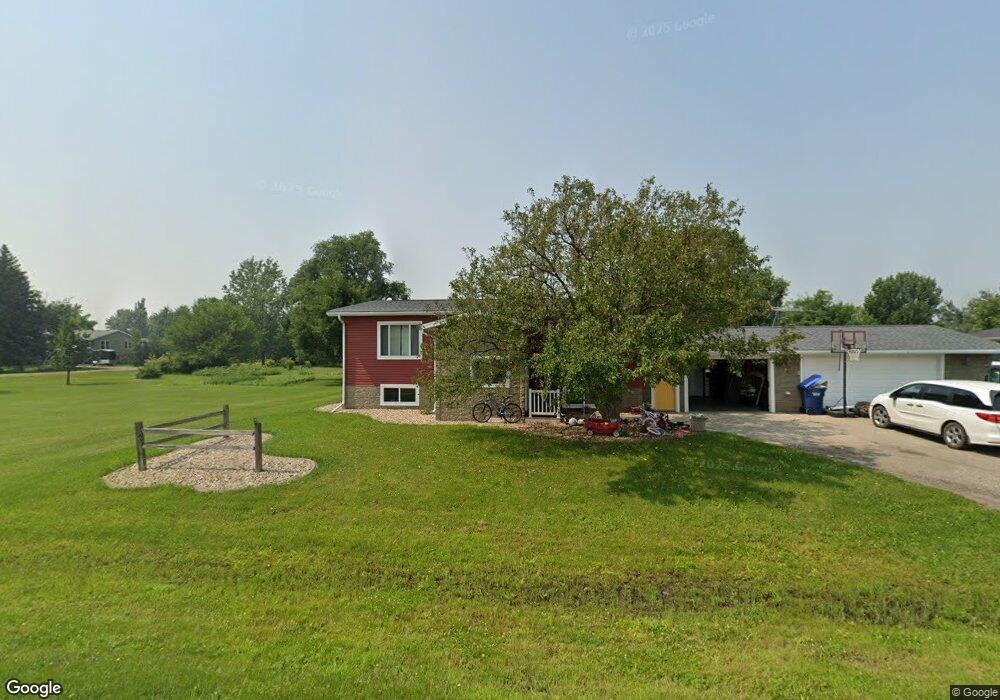
275 5th St Davenport, ND 58021
Estimated Value: $311,000 - $332,000
4
Beds
2
Baths
2,260
Sq Ft
$142/Sq Ft
Est. Value
About This Home
This home is located at 275 5th St, Davenport, ND 58021 and is currently estimated at $321,003, approximately $142 per square foot. 275 5th St is a home located in Cass County with nearby schools including Kindred Elementary School and Kindred High School.
Ownership History
Date
Name
Owned For
Owner Type
Purchase Details
Closed on
Dec 15, 2016
Sold by
Mitchell Brady A and Mitchell Jennifer M
Bought by
Binfet James A and Binfet Katyly N
Current Estimated Value
Home Financials for this Owner
Home Financials are based on the most recent Mortgage that was taken out on this home.
Original Mortgage
$201,000
Outstanding Balance
$162,404
Interest Rate
3.54%
Mortgage Type
VA
Estimated Equity
$158,599
Purchase Details
Closed on
Oct 28, 2013
Sold by
Murphy Charles L and Murphy Nancy L
Bought by
Mitchell Brady and Mitchell Jennifer
Home Financials for this Owner
Home Financials are based on the most recent Mortgage that was taken out on this home.
Original Mortgage
$12,800
Interest Rate
4%
Mortgage Type
Future Advance Clause Open End Mortgage
Purchase Details
Closed on
Sep 23, 2011
Sold by
Murphy Charles L and Murphy Nancy L
Bought by
Mitchell Brady A and Mitchell Jennifer M
Home Financials for this Owner
Home Financials are based on the most recent Mortgage that was taken out on this home.
Original Mortgage
$6,859
Interest Rate
6%
Mortgage Type
Future Advance Clause Open End Mortgage
Create a Home Valuation Report for This Property
The Home Valuation Report is an in-depth analysis detailing your home's value as well as a comparison with similar homes in the area
Purchase History
| Date | Buyer | Sale Price | Title Company |
|---|---|---|---|
| Binfet James A | $219,250 | Title Co | |
| Mitchell Brady | -- | None Available | |
| Mitchell Brady A | $149,000 | -- |
Source: Public Records
Mortgage History
| Date | Status | Borrower | Loan Amount |
|---|---|---|---|
| Open | Binfet James A | $201,000 | |
| Previous Owner | Mitchell Brady | $12,800 | |
| Previous Owner | Mitchell Brady A | $6,859 |
Source: Public Records
Tax History
| Year | Tax Paid | Tax Assessment Tax Assessment Total Assessment is a certain percentage of the fair market value that is determined by local assessors to be the total taxable value of land and additions on the property. | Land | Improvement |
|---|---|---|---|---|
| 2024 | $3,157 | $134,250 | $12,500 | $121,750 |
| 2023 | $3,409 | $127,600 | $12,500 | $115,100 |
| 2022 | $3,555 | $118,950 | $7,000 | $111,950 |
| 2021 | $2,470 | $108,150 | $7,000 | $101,150 |
| 2020 | $2,612 | $99,050 | $7,000 | $92,050 |
| 2019 | $2,179 | $99,050 | $7,000 | $92,050 |
| 2018 | $2,206 | $98,100 | $7,000 | $91,100 |
| 2017 | $1,698 | $77,250 | $6,600 | $70,650 |
| 2016 | $1,559 | $73,300 | $6,000 | $67,300 |
| 2015 | $1,455 | $72,500 | $6,000 | $66,500 |
| 2014 | $1,624 | $65,000 | $6,000 | $59,000 |
| 2013 | $1,350 | $54,600 | $6,000 | $48,600 |
Source: Public Records
Map
Nearby Homes
Your Personal Tour Guide
Ask me questions while you tour the home.