NOT LISTED FOR SALE

275 Augustine Dr Spartanburg, SC 29306

Estimated Value: $275,000 - $302,000

3 Beds
2 Baths
1,498 Sq Ft
$191/Sq Ft Est. Value

Last Sold May 07, 2021

Last sale price $202,000 $135 Per Sq Ft

Est. 42% increase in value since last sale

Current estimated payment $1,643/month

About This Home

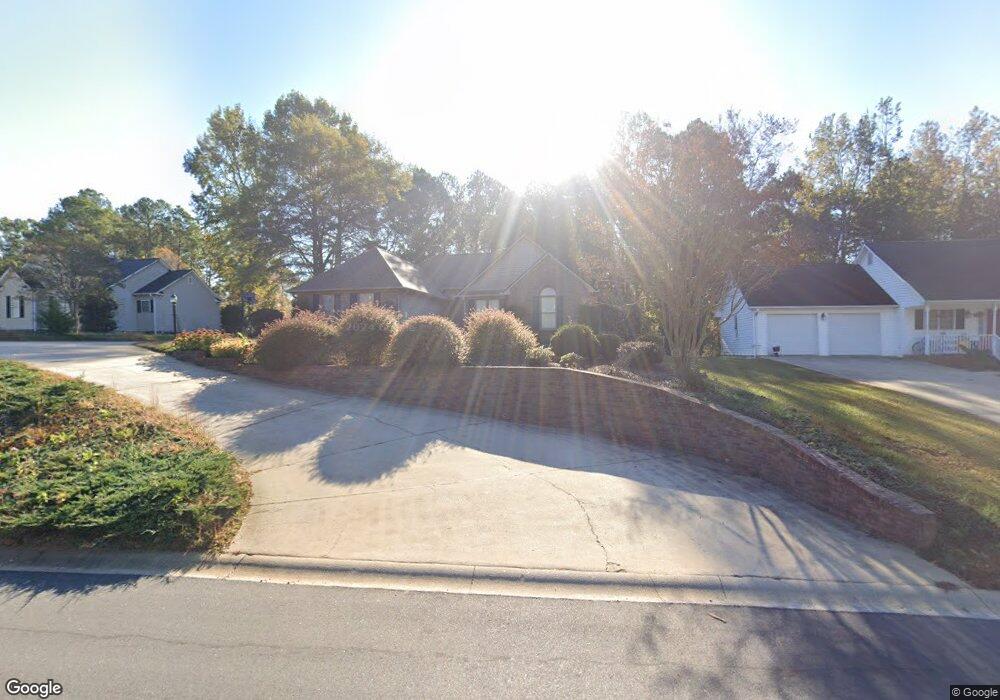
This home is located at 275 Augustine Dr, Spartanburg, SC 29306 and is currently estimated at $286,030, approximately $190 per square foot. 275 Augustine Dr is a home located in Spartanburg County with nearby schools including Dorman High School Freshman Campus and Dorman High School.

Ownership History

Date Name Owned For Owner Type

Purchase Details

Listed on
Mar 29, 2021
Closed on
May 7, 2021
Sold by
Griffith Anna E
Bought by
Davis Justin M and Davis Katrina B
Seller's Agent
Cynthia Barrett
Real Broker, LLC
Buyer's Agent
NON MLS MEMBER
Non MLS
List Price
$192,900
Sold Price
$202,000
Premium/Discount to List
$9,100
4.72%
Current Estimated Value
$286,030

Home Financials for this Owner

Home Financials are based on the most recent Mortgage that was taken out on this home.
Estimated Appreciation
$84,030
Avg. Annual Appreciation
8.07%
Original Mortgage
$190,000
Outstanding Balance
$173,593
Interest Rate
3.64%
Mortgage Type
New Conventional
Estimated Equity
$112,437
Source: Public Records

Range of Values:

Collateral Analytics

Collateral Analytics Collateral Analytics AVMs (Automated Valuation Model) employ a number of statistical approaches combined with neighborhood-specific comparable selection guarantees the most up-to-date and precise valuations.

Not Available

Collateral Analytics does not have data for the current month. Please view the chart for historical values.

ICE

ICE Mortgage Technology ICE Mortgage Technology’s AVM (Automated Valuation Model) is a state-of-the-art online residential property valuation tool that provides a quick and accurate estimate of the value of almost any home in the U.S.

Not Available

ICE Mortgage Technology does not have data for the current month. Please view the chart for historical values.

First American

First American First American Data & Analytics’ next-generation AVM combines unrivaled data assets with a blended ensemble of valuation models to produce highly accurate, reliable valuations you can trust.

Not Available

First American does not have data for the current month. Please view the chart for historical values.

Quantarium

Quantarium Quantarium’s valuation service, repeatedly proven the industry’s most accurate and comprehensive, is supercharged with a self-learning and auto-tuning AI engine that continually becomes smarter and more accurate as it processes daily inputs from the industry’s leading RE data lake.

Not Available

Quantarium does not have data for the current month. Please view the chart for historical values.

Average Value
Not Available
List Price
Sold Price
Create a Home Valuation Report for This Property
The Home Valuation Report is an in-depth analysis detailing your home's value as well as a comparison with similar homes in the area

Home Values in the Area

Source: Public Records

Average Home Value in this Area


Source: Public Records

Purchase History

Date Buyer Sale Price Title Company
Davis Justin M $202,000 None Available
Source: Public Records

Mortgage History

Date Status Borrower Loan Amount
Open Davis Justin M $190,000
Source: Public Records

Property History

Date Event Price List to Sale Price per Sq Ft Prior Sale
05/07/2021 05/07/21 Sold $202,000 +4.7% $144 / Sq Ft View Prior Sale
03/29/2021 03/29/21 For Sale $192,900 -- $138 / Sq Ft

Tax History Compared to Growth

Source: Public Records

Tax History

Year Tax Paid Tax Assessment Tax Assessment Total Assessment is a certain percentage of the fair market value that is determined by local assessors to be the total taxable value of land and additions on the property. Land Improvement
2025 $1,671 $9,292 $819 $8,473
2024 $1,671 $9,292 $819 $8,473
2023 $1,671 $9,292 $819 $8,473
2022 $1,507 $8,080 $720 $7,360
2021 $676 $5,464 $688 $4,776
2020 $657 $5,464 $688 $4,776
2019 $639 $5,464 $688 $4,776
2018 $642 $5,464 $688 $4,776
2017 $513 $4,752 $720 $4,032
2016 $524 $4,752 $720 $4,032
2015 $515 $4,752 $720 $4,032
2014 $496 $4,752 $720 $4,032
Source: Public Records

Agents Affiliated with this Home

  • Section Image
See All Agents

Map