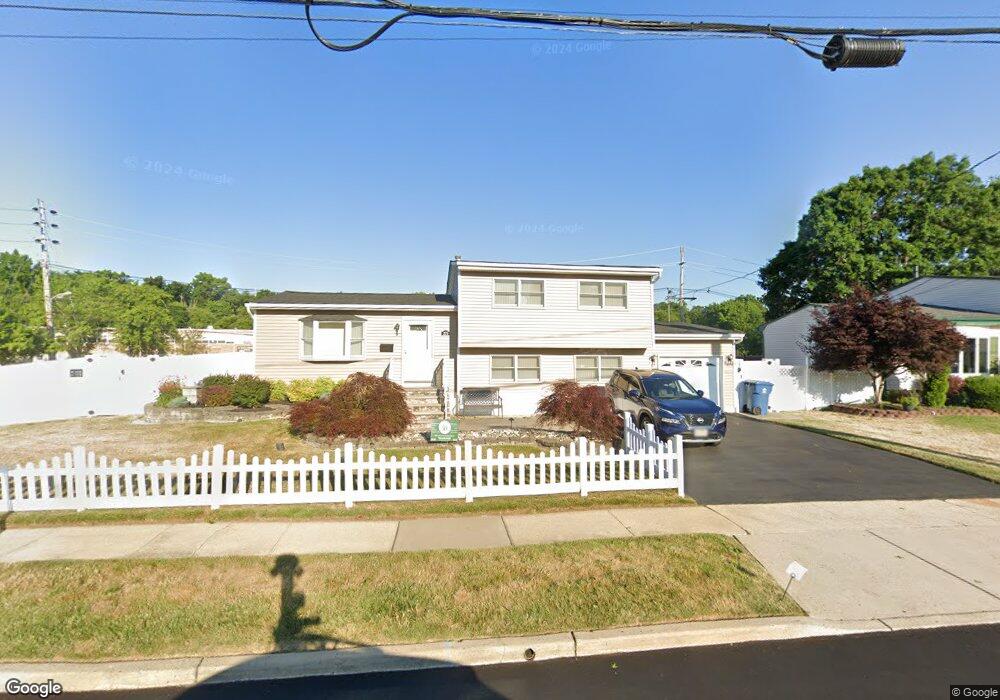
275 Cindy St Old Bridge, NJ 08857
Estimated Value: $596,816 - $677,000
--
Bed
--
Bath
1,659
Sq Ft
$384/Sq Ft
Est. Value
About This Home
This home is located at 275 Cindy St, Old Bridge, NJ 08857 and is currently estimated at $636,454, approximately $383 per square foot. 275 Cindy St is a home located in Middlesex County with nearby schools including Old Bridge High School, St. Ambrose School, and Calvary Christian School.
Ownership History
Date
Name
Owned For
Owner Type
Purchase Details
Closed on
Mar 16, 2007
Current Estimated Value
Purchase Details
Closed on
Nov 17, 2003
Sold by
Small Michael
Bought by
Vivo Andrew and Vivo Laura
Home Financials for this Owner
Home Financials are based on the most recent Mortgage that was taken out on this home.
Original Mortgage
$252,500
Interest Rate
5.71%
Create a Home Valuation Report for This Property
The Home Valuation Report is an in-depth analysis detailing your home's value as well as a comparison with similar homes in the area
Home Values in the Area
Average Home Value in this Area
Purchase History
| Date | Buyer | Sale Price | Title Company |
|---|---|---|---|
| -- | $75,000 | -- | |
| Vivo Andrew | $317,500 | -- |
Source: Public Records
Mortgage History
| Date | Status | Borrower | Loan Amount |
|---|---|---|---|
| Previous Owner | Vivo Andrew | $252,500 |
Source: Public Records
Tax History Compared to Growth
Tax History
| Year | Tax Paid | Tax Assessment Tax Assessment Total Assessment is a certain percentage of the fair market value that is determined by local assessors to be the total taxable value of land and additions on the property. | Land | Improvement |
|---|---|---|---|---|
| 2025 | $8,798 | $155,800 | $73,000 | $82,800 |
| 2024 | $8,440 | $155,800 | $73,000 | $82,800 |
| 2023 | $8,440 | $155,800 | $73,000 | $82,800 |
| 2022 | $8,246 | $155,800 | $73,000 | $82,800 |
| 2021 | $5,955 | $153,300 | $73,000 | $80,300 |
| 2020 | $7,875 | $153,300 | $73,000 | $80,300 |
| 2019 | $7,742 | $153,300 | $73,000 | $80,300 |
| 2018 | $7,656 | $153,300 | $73,000 | $80,300 |
| 2017 | $7,407 | $153,300 | $73,000 | $80,300 |
| 2016 | $7,254 | $153,300 | $73,000 | $80,300 |
| 2015 | $7,128 | $153,300 | $73,000 | $80,300 |
| 2014 | $7,056 | $153,300 | $73,000 | $80,300 |
Source: Public Records
Map
Nearby Homes