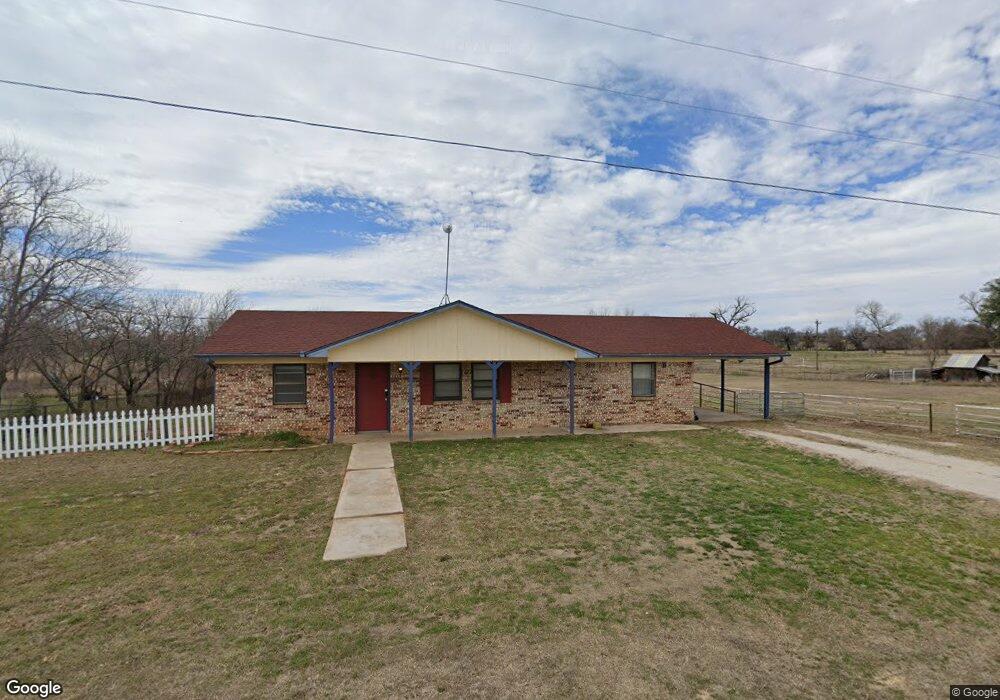
275 County Road 3695 Springtown, TX 76082
Estimated Value: $323,457 - $369,000
3
Beds
2
Baths
1,250
Sq Ft
$280/Sq Ft
Est. Value
About This Home
This home is located at 275 County Road 3695, Springtown, TX 76082 and is currently estimated at $349,486, approximately $279 per square foot. 275 County Road 3695 is a home located in Wise County with nearby schools including Springtown Elementary School, Springtown Intermediate School, and Springtown Middle School.
Ownership History
Date
Name
Owned For
Owner Type
Purchase Details
Closed on
Mar 30, 2023
Sold by
Howe Daniel Patrick
Bought by
Hurt William and Hurt Matthew
Current Estimated Value
Home Financials for this Owner
Home Financials are based on the most recent Mortgage that was taken out on this home.
Original Mortgage
$247,500
Outstanding Balance
$240,495
Interest Rate
6.5%
Mortgage Type
New Conventional
Estimated Equity
$108,991
Purchase Details
Closed on
Nov 21, 2017
Sold by
Blay Sammy and Blay Kathryn J
Bought by
Howe Daniel Patrick
Home Financials for this Owner
Home Financials are based on the most recent Mortgage that was taken out on this home.
Original Mortgage
$161,029
Interest Rate
3.88%
Mortgage Type
FHA
Purchase Details
Closed on
Jul 17, 2001
Sold by
Anderson William T and Anderson Vicki R
Bought by
Blay Sammy and Blay Kathryn
Purchase Details
Closed on
Jan 1, 1901
Bought by
Blay Sammy and Blay Kathryn
Create a Home Valuation Report for This Property
The Home Valuation Report is an in-depth analysis detailing your home's value as well as a comparison with similar homes in the area
Home Values in the Area
Average Home Value in this Area
Purchase History
| Date | Buyer | Sale Price | Title Company |
|---|---|---|---|
| Hurt William | -- | None Listed On Document | |
| Howe Daniel Patrick | -- | Old Republic Title | |
| Blay Sammy | -- | -- | |
| Blay Sammy | -- | -- |
Source: Public Records
Mortgage History
| Date | Status | Borrower | Loan Amount |
|---|---|---|---|
| Open | Hurt William | $247,500 | |
| Previous Owner | Howe Daniel Patrick | $161,029 |
Source: Public Records
Tax History
| Year | Tax Paid | Tax Assessment Tax Assessment Total Assessment is a certain percentage of the fair market value that is determined by local assessors to be the total taxable value of land and additions on the property. | Land | Improvement |
|---|---|---|---|---|
| 2025 | $1,273 | $306,252 | $132,643 | $173,609 |
| 2024 | $1,273 | $306,782 | $132,643 | $174,139 |
| 2023 | $3,589 | $284,177 | $132,643 | $151,534 |
| 2022 | $3,903 | $239,028 | $101,555 | $137,473 |
| 2021 | $3,363 | $204,190 | $76,620 | $127,570 |
| 2020 | $2,894 | $174,290 | $61,170 | $113,120 |
| 2019 | $3,055 | $172,390 | $61,170 | $111,220 |
| 2018 | $2,773 | $148,780 | $40,890 | $107,890 |
| 2017 | $2,034 | $109,110 | $14,910 | $94,200 |
| 2016 | $1,858 | $101,770 | $14,910 | $86,860 |
| 2015 | -- | $90,620 | $12,440 | $78,180 |
| 2014 | -- | $88,000 | $13,940 | $74,060 |
Source: Public Records
Map
Nearby Homes
- 1556 Thomas Rd
- 2691 N Fm Road 51
- 253 County Road 4899
- 165 County Road 4896
- 111 Quail Dr
- 128 Spring Creek Cir
- 917 County Road 3798
- 443 County Road 3799
- 121 Bluff Ridge Ct
- 808 Feather Edge Dr
- 8 Acres TBD Hwy 51
- TBD County Road 3799
- 207 Lazy b Ln
- 1030 Alex Dr
- 512 Allison Rd
- 572 County Road 3799
- 1973 Johnnie Dr
- 501 Lazy b Ln
- 1005 Ronnie Ct
- 1460 County Road 3591
- 267 County Road 3695
- 247 County Road 3695
- 285 County Road 3695
- 199 County Road 3694
- 235 County Road 3695
- 274 County Road 3695
- 227 County Road 3695
- 291 County Road 3695
- 291 County Road 3695
- 219 County Road 3695
- 181 County Road 3694
- 178 County Road 3694
- 9999 County Road 3698
- 177 County Road 3695
- 198 County Road 3698
- 198 Cr-3698
- 157 County Road 3694
- 175 County Road 3695
- 182 County Road 3698
- 443 County Road 3699
Your Personal Tour Guide
Ask me questions while you tour the home.