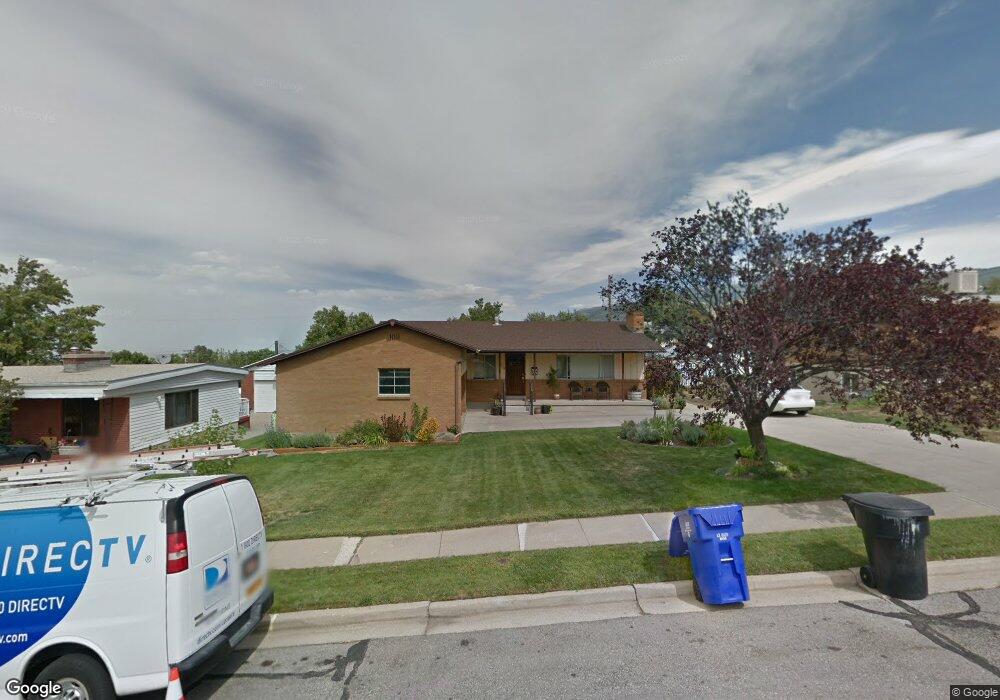
275 E 1950 S Bountiful, UT 84010
Estimated Value: $519,000 - $551,000
4
Beds
2
Baths
2,544
Sq Ft
$208/Sq Ft
Est. Value
About This Home
This home is located at 275 E 1950 S, Bountiful, UT 84010 and is currently estimated at $530,277, approximately $208 per square foot. 275 E 1950 S is a home located in Davis County with nearby schools including Muir School, Mueller Park Junior High School, and Bountiful High School.
Ownership History
Date
Name
Owned For
Owner Type
Purchase Details
Closed on
Apr 7, 2021
Sold by
Harker Jon Erik and Harker Jenna D
Bought by
Harker Jon Erik and Harker Jenna R
Current Estimated Value
Home Financials for this Owner
Home Financials are based on the most recent Mortgage that was taken out on this home.
Original Mortgage
$295,000
Outstanding Balance
$265,334
Interest Rate
2.9%
Mortgage Type
New Conventional
Estimated Equity
$264,943
Purchase Details
Closed on
Oct 15, 2014
Sold by
Dahl Michael V and Dahl Debbie P
Bought by
Harker Jon Erik and Harker Jenna D
Purchase Details
Closed on
Mar 8, 2012
Sold by
England Afton N
Bought by
Dahl Michael and Dahl Debbie P
Home Financials for this Owner
Home Financials are based on the most recent Mortgage that was taken out on this home.
Original Mortgage
$134,700
Interest Rate
3.92%
Mortgage Type
New Conventional
Create a Home Valuation Report for This Property
The Home Valuation Report is an in-depth analysis detailing your home's value as well as a comparison with similar homes in the area
Purchase History
| Date | Buyer | Sale Price | Title Company |
|---|---|---|---|
| Harker Jon Erik | -- | Us Title Company Of Utah | |
| Harker Jon Erik | -- | None Available | |
| Dahl Michael | -- | Backman Title Servic |
Source: Public Records
Mortgage History
| Date | Status | Borrower | Loan Amount |
|---|---|---|---|
| Open | Harker Jon Erik | $295,000 | |
| Previous Owner | Dahl Michael | $134,700 |
Source: Public Records
Tax History
| Year | Tax Paid | Tax Assessment Tax Assessment Total Assessment is a certain percentage of the fair market value that is determined by local assessors to be the total taxable value of land and additions on the property. | Land | Improvement |
|---|---|---|---|---|
| 2025 | $2,905 | $261,800 | $134,765 | $127,035 |
| 2024 | $2,698 | $252,450 | $120,006 | $132,444 |
| 2023 | $2,591 | $440,000 | $220,402 | $219,598 |
| 2022 | $2,739 | $255,750 | $120,249 | $135,501 |
| 2021 | $2,341 | $333,000 | $157,390 | $175,610 |
| 2020 | $2,071 | $295,000 | $134,191 | $160,809 |
| 2019 | $2,097 | $292,000 | $139,998 | $152,002 |
| 2018 | $1,952 | $267,000 | $135,057 | $131,943 |
| 2016 | $1,676 | $124,025 | $51,276 | $72,749 |
| 2015 | $1,650 | $115,335 | $51,276 | $64,059 |
| 2014 | $1,605 | $115,420 | $51,276 | $64,144 |
| 2013 | -- | $97,872 | $51,700 | $46,172 |
Source: Public Records
Map
Nearby Homes
- 296 E 2050 S Unit 2
- 2038 S 350 E Unit 3
- 2059 S 350 E Unit 6
- 2046 S 350 E Unit 4
- 295 E 2050 S Unit 1
- 188 E 2050 S Unit D3
- 2053 S 350 E Unit 7
- 320 E 2100 S
- 1886 S Jeri Dr
- 2064 S Orchard Dr
- 2273 S 200 E
- 2 E Wicker Ln
- 141 E 1650 S
- 110 2250 S
- 41 E 2200 S
- 2292 S 250 E
- 1820 S 50 W
- 380 E 1500 S
- 631 E 1700 S
- 1761 S Davis Blvd
Your Personal Tour Guide
Ask me questions while you tour the home.