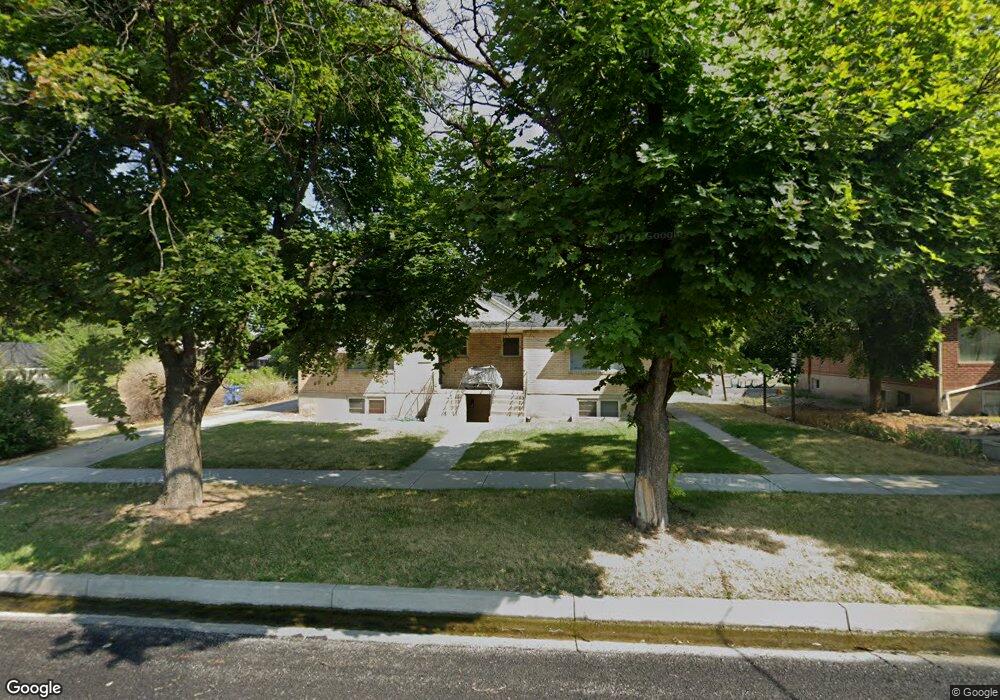
275 E 500 N Logan, UT 84321
Adams NeighborhoodEstimated Value: $378,000 - $859,000
Studio
--
Bath
1,452
Sq Ft
$438/Sq Ft
Est. Value
About This Home
This home is located at 275 E 500 N, Logan, UT 84321 and is currently estimated at $635,667, approximately $437 per square foot. 275 E 500 N is a home with nearby schools including Adams Elementary School, Mount Logan Middle School, and Logan High School.
Ownership History
Date
Name
Owned For
Owner Type
Purchase Details
Closed on
Dec 16, 2011
Sold by
Hadfield Bretton K
Bought by
Hb 275E Llc
Current Estimated Value
Purchase Details
Closed on
Aug 17, 2011
Sold by
Hadfield Bretton K
Bought by
Hadfield Bretton K
Home Financials for this Owner
Home Financials are based on the most recent Mortgage that was taken out on this home.
Original Mortgage
$136,500
Interest Rate
4.53%
Mortgage Type
Commercial
Purchase Details
Closed on
May 3, 2011
Sold by
Johnson Elsa Merlene Yonk and Yonk Richard Garland
Bought by
Hadfield Bretton K
Home Financials for this Owner
Home Financials are based on the most recent Mortgage that was taken out on this home.
Original Mortgage
$137,000
Interest Rate
4.77%
Mortgage Type
Commercial
Create a Home Valuation Report for This Property
The Home Valuation Report is an in-depth analysis detailing your home's value as well as a comparison with similar homes in the area
Home Values in the Area
Average Home Value in this Area
Purchase History
| Date | Buyer | Sale Price | Title Company |
|---|---|---|---|
| Hb 275E Llc | -- | None Available | |
| Hadfield Bretton K | -- | Hickman Land Title Company | |
| Hadfield Bretton K | -- | Hickman Land Title Company |
Source: Public Records
Mortgage History
| Date | Status | Borrower | Loan Amount |
|---|---|---|---|
| Previous Owner | Hadfield Bretton K | $136,500 | |
| Previous Owner | Hadfield Bretton K | $137,000 |
Source: Public Records
Tax History
| Year | Tax Paid | Tax Assessment Tax Assessment Total Assessment is a certain percentage of the fair market value that is determined by local assessors to be the total taxable value of land and additions on the property. | Land | Improvement |
|---|---|---|---|---|
| 2025 | $2,604 | $612,230 | $178,500 | $433,730 |
| 2023 | $2,804 | $608,730 | $175,000 | $433,730 |
| 2022 | $3,003 | $608,730 | $175,000 | $433,730 |
| 2021 | $3,058 | $526,700 | $132,400 | $394,300 |
| 2020 | $1,742 | $270,100 | $90,000 | $180,100 |
| 2019 | $1,821 | $270,100 | $90,000 | $180,100 |
| 2018 | $1,537 | $208,208 | $70,000 | $138,208 |
| 2017 | $1,486 | $106,370 | $0 | $0 |
| 2016 | $1,540 | $103,620 | $0 | $0 |
| 2015 | $1,502 | $103,620 | $0 | $0 |
| 2014 | $1,358 | $103,620 | $0 | $0 |
| 2013 | -- | $100,730 | $0 | $0 |
Source: Public Records
Map
Nearby Homes
Your Personal Tour Guide
Ask me questions while you tour the home.