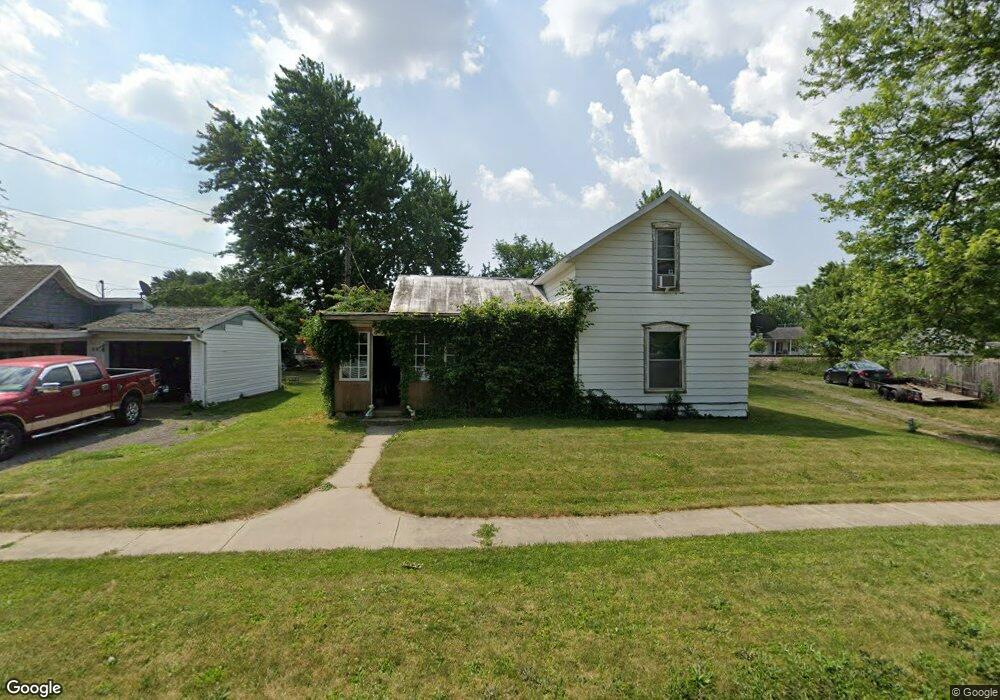
275 E Main St Mc Comb, OH 45858
McComb NeighborhoodEstimated Value: $73,000 - $168,000
3
Beds
1
Bath
1,472
Sq Ft
$76/Sq Ft
Est. Value
About This Home
This home is located at 275 E Main St, Mc Comb, OH 45858 and is currently estimated at $112,080, approximately $76 per square foot. 275 E Main St is a home with nearby schools including McComb Elementary School, McComb Middle School, and Mccomb Local High School.
Ownership History
Date
Name
Owned For
Owner Type
Purchase Details
Closed on
Feb 25, 2022
Sold by
Fasig Timothy W
Bought by
Cortez Refugio L
Current Estimated Value
Purchase Details
Closed on
May 12, 2000
Sold by
Nigh Ralph A
Bought by
Rayle Daniel J and Rayle Sharon R
Home Financials for this Owner
Home Financials are based on the most recent Mortgage that was taken out on this home.
Original Mortgage
$39,500
Interest Rate
8.26%
Mortgage Type
New Conventional
Purchase Details
Closed on
Mar 9, 1993
Bought by
Fasig Timothy W and Fasig Cynthia
Create a Home Valuation Report for This Property
The Home Valuation Report is an in-depth analysis detailing your home's value as well as a comparison with similar homes in the area
Home Values in the Area
Average Home Value in this Area
Purchase History
| Date | Buyer | Sale Price | Title Company |
|---|---|---|---|
| Cortez Refugio L | $39,766 | None Listed On Document | |
| Cortez Refugio L | $39,766 | None Listed On Document | |
| Rayle Daniel J | $40,000 | -- | |
| Fasig Timothy W | -- | -- |
Source: Public Records
Mortgage History
| Date | Status | Borrower | Loan Amount |
|---|---|---|---|
| Previous Owner | Rayle Daniel J | $39,500 |
Source: Public Records
Tax History
| Year | Tax Paid | Tax Assessment Tax Assessment Total Assessment is a certain percentage of the fair market value that is determined by local assessors to be the total taxable value of land and additions on the property. | Land | Improvement |
|---|---|---|---|---|
| 2024 | $719 | $21,170 | $3,960 | $17,210 |
| 2023 | $714 | $21,170 | $3,960 | $17,210 |
| 2022 | $852 | $21,170 | $3,960 | $17,210 |
| 2021 | $754 | $13,920 | $3,970 | $9,950 |
| 2020 | $554 | $13,920 | $3,970 | $9,950 |
| 2019 | $605 | $13,920 | $3,970 | $9,950 |
| 2018 | $531 | $12,790 | $2,840 | $9,950 |
| 2017 | $267 | $12,790 | $2,840 | $9,950 |
| 2016 | $1,352 | $6,460 | $2,020 | $4,440 |
| 2015 | $257 | $6,460 | $2,020 | $4,440 |
| 2014 | $269 | $6,460 | $2,020 | $4,440 |
| 2012 | $315 | $7,360 | $2,020 | $5,340 |
Source: Public Records
Map
Nearby Homes
- 257 S Main St
- 131 E South St
- 0 Joshua Rd Unit 6126475
- 223 Cherry St
- 4609 Township Road 235
- 3470 Ohio 235
- 4134 County Road 203
- 3111 Township Road 93
- 4014 County Road 139
- 358 State Route 613
- 1128 County Road 139
- 7780 Township Road 89
- 0 Rock Candy Rd Unit Lot 159
- 0 Rock Candy Rd Unit Lot 170
- 0 Rock Candy Rd Unit Lot 172 206819
- 0 Rock Candy Rd Unit Lot 162
- 0 Rock Candy Rd Unit Lot 171
- 0 Rock Candy Rd Unit Lot 168
- 9894 Smokies Way
- 0 Rock Candy Rd Or Bushwillow Dr Unit Lot 173
Your Personal Tour Guide
Ask me questions while you tour the home.