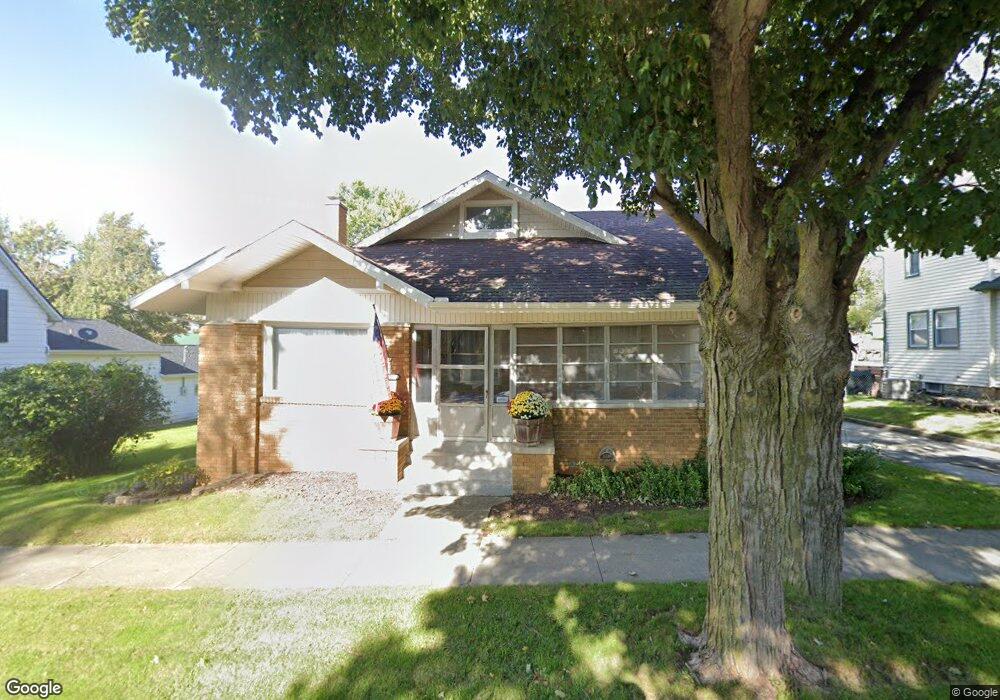
275 E Morse St Markle, IN 46770
Estimated Value: $175,000 - $226,000
2
Beds
2
Baths
2,899
Sq Ft
$66/Sq Ft
Est. Value
About This Home
This home is located at 275 E Morse St, Markle, IN 46770 and is currently estimated at $192,351, approximately $66 per square foot. 275 E Morse St is a home located in Huntington County with nearby schools including Salamonie School and Huntington North High School.
Ownership History
Date
Name
Owned For
Owner Type
Purchase Details
Closed on
Mar 17, 2022
Sold by
Michelle Leffert Deeda
Bought by
Leffert Deeda Michelle and Leffert Deeda Michelle
Current Estimated Value
Home Financials for this Owner
Home Financials are based on the most recent Mortgage that was taken out on this home.
Original Mortgage
$102,400
Outstanding Balance
$82,931
Interest Rate
3.39%
Mortgage Type
New Conventional
Estimated Equity
$109,420
Purchase Details
Closed on
Jun 20, 2006
Sold by
Snow Craig A
Bought by
Snow Deeda M
Create a Home Valuation Report for This Property
The Home Valuation Report is an in-depth analysis detailing your home's value as well as a comparison with similar homes in the area
Purchase History
| Date | Buyer | Sale Price | Title Company |
|---|---|---|---|
| Leffert Deeda Michelle | -- | Mters Hockemeyer & Mcnagny Llp | |
| Snow Deeda M | -- | None Available |
Source: Public Records
Mortgage History
| Date | Status | Borrower | Loan Amount |
|---|---|---|---|
| Open | Leffert Deeda Michelle | $102,400 |
Source: Public Records
Tax History
| Year | Tax Paid | Tax Assessment Tax Assessment Total Assessment is a certain percentage of the fair market value that is determined by local assessors to be the total taxable value of land and additions on the property. | Land | Improvement |
|---|---|---|---|---|
| 2024 | $1,282 | $128,200 | $9,800 | $118,400 |
| 2023 | $2,254 | $112,700 | $9,800 | $102,900 |
| 2022 | $903 | $104,900 | $9,800 | $95,100 |
| 2021 | $949 | $101,500 | $9,800 | $91,700 |
| 2020 | $801 | $92,000 | $9,800 | $82,200 |
| 2019 | $650 | $85,600 | $9,800 | $75,800 |
| 2018 | $719 | $85,600 | $9,800 | $75,800 |
| 2017 | $663 | $85,100 | $9,800 | $75,300 |
| 2016 | $516 | $81,800 | $9,800 | $72,000 |
| 2014 | $471 | $78,600 | $9,800 | $68,800 |
| 2013 | $471 | $80,200 | $9,800 | $70,400 |
Source: Public Records
Map
Nearby Homes
- 255 E Morse St
- 245 E Morse St
- 270 E Sparks St
- 260 E Sparks St
- 270 E Morse St
- 305 E Morse St
- 235 E Morse St
- 260 E Morse St
- 250 E Morse St
- 315 E Morse St
- 230 E Morse St
- 180 N Miller St
- 160 N Miller St
- 310 E Morse St
- 220 E Morse St
- 210 E Morse St
- 415 E Morse St
- 240 N County Line Rd
- 330 E Morse St
- 275 E Sparks St
Your Personal Tour Guide
Ask me questions while you tour the home.