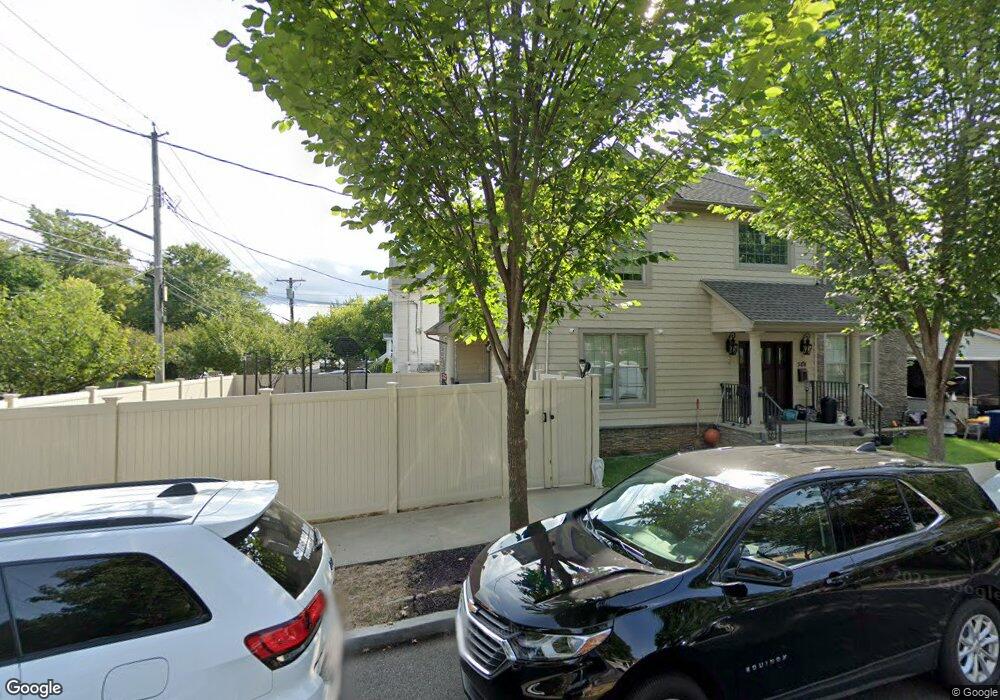
275 Edgegrove Ave Staten Island, NY 10312
Annadale NeighborhoodEstimated Value: $901,000 - $1,297,000
--
Bed
4
Baths
2,558
Sq Ft
$425/Sq Ft
Est. Value
About This Home
This home is located at 275 Edgegrove Ave, Staten Island, NY 10312 and is currently estimated at $1,085,904, approximately $424 per square foot. 275 Edgegrove Ave is a home located in Richmond County with nearby schools including P.S. 36 - J.C. Drumgoole, I.S. 007 Elias Bernstein, and Tottenville High School.
Ownership History
Date
Name
Owned For
Owner Type
Purchase Details
Closed on
Feb 2, 2016
Sold by
Touhey Patrick
Bought by
Touhey Patrick and Touhey Kimberly
Current Estimated Value
Home Financials for this Owner
Home Financials are based on the most recent Mortgage that was taken out on this home.
Original Mortgage
$607,500
Outstanding Balance
$480,640
Interest Rate
3.72%
Mortgage Type
New Conventional
Estimated Equity
$605,264
Purchase Details
Closed on
Oct 9, 2012
Sold by
Pockets Development Corp
Bought by
Touhey Patrick
Purchase Details
Closed on
Nov 28, 2011
Sold by
Lentine Brandon
Bought by
Pockets Development Corp
Purchase Details
Closed on
Jun 5, 2006
Sold by
Biddle Christine
Bought by
Lentine Brandon
Home Financials for this Owner
Home Financials are based on the most recent Mortgage that was taken out on this home.
Original Mortgage
$360,000
Interest Rate
7.12%
Mortgage Type
Purchase Money Mortgage
Create a Home Valuation Report for This Property
The Home Valuation Report is an in-depth analysis detailing your home's value as well as a comparison with similar homes in the area
Home Values in the Area
Average Home Value in this Area
Purchase History
| Date | Buyer | Sale Price | Title Company |
|---|---|---|---|
| Touhey Patrick | -- | Stewart Title Insurance Co | |
| Touhey Patrick | -- | None Available | |
| Pockets Development Corp | $295,000 | Commonwealth Land Title Insu | |
| Lentine Brandon | $450,000 | The Judicial Title Agency Ll |
Source: Public Records
Mortgage History
| Date | Status | Borrower | Loan Amount |
|---|---|---|---|
| Open | Touhey Patrick | $607,500 | |
| Previous Owner | Lentine Brandon | $360,000 |
Source: Public Records
Tax History Compared to Growth
Tax History
| Year | Tax Paid | Tax Assessment Tax Assessment Total Assessment is a certain percentage of the fair market value that is determined by local assessors to be the total taxable value of land and additions on the property. | Land | Improvement |
|---|---|---|---|---|
| 2025 | $8,667 | $81,840 | $9,021 | $72,819 |
| 2024 | $8,667 | $68,940 | $10,103 | $58,837 |
| 2023 | $8,590 | $42,296 | $9,618 | $32,678 |
| 2022 | $8,100 | $58,920 | $16,140 | $42,780 |
| 2021 | $8,463 | $50,160 | $16,140 | $34,020 |
| 2020 | $8,069 | $50,880 | $16,140 | $34,740 |
| 2019 | $7,523 | $55,200 | $16,140 | $39,060 |
| 2018 | $7,185 | $35,247 | $11,328 | $23,919 |
| 2017 | $6,893 | $33,812 | $12,225 | $21,587 |
| 2016 | $6,699 | $33,512 | $13,199 | $20,313 |
| 2015 | $4,984 | $32,111 | $11,811 | $20,300 |
| 2014 | $4,984 | $25,969 | $10,996 | $14,973 |
Source: Public Records
Map
Nearby Homes
- 237 Edgegrove Ave
- 217 Edgegrove Ave
- 338 Edgegrove Ave
- 242 Rathbun Ave
- 2 Radnor St
- 382 Edgegrove Ave
- 172 N Railroad St
- 164 N Railroad St
- 287 Rensselaer Ave
- 160 Rathbun Ave
- 26 Buffington Ave
- 291 Rensselaer Ave
- 308 Sheldon Ave
- 295 Rensselaer Ave
- 674 Arden Ave
- 670 Arden Ave
- 50 Buffington Ave
- 1186 Arden Ave
- 966 Drumgoole Rd W
- 138 Rathbun Ave
- 364 Belfield Ave
- 279 Edgegrove Ave
- 279 Edgegrove Ave Unit 289
- 279 Edgegrove Ave Unit A
- 354 Belfield Ave
- 263 Edgegrove Ave
- 278 Ionia Ave
- 282 Ionia Ave
- 278 Edgegrove Ave
- 286 Ionia Ave
- 289 Edgegrove Ave
- 290 Ionia Ave
- 0 Belfield Ave
- 260 Ionia Ave
- 288 Edgegrove Ave
- 253 Edgegrove Ave
- 260 Edgegrove Ave
- 233 Edgegrove Ave
- 258 Ionia Ave
- 249 Edgegrove Ave