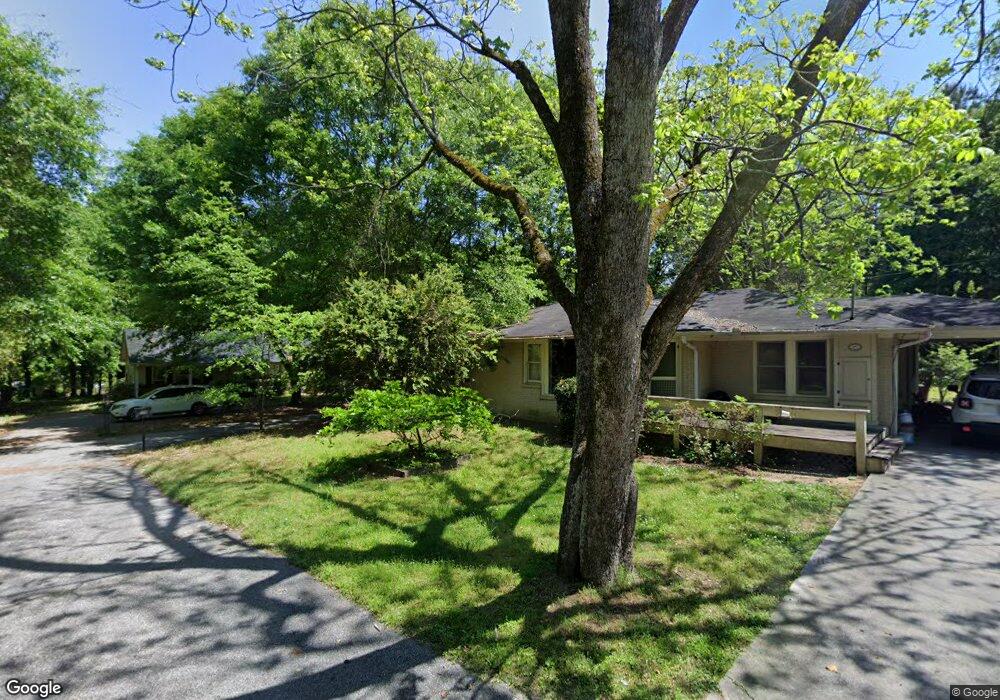
275 Grove St Winder, GA 30680
Estimated Value: $257,394 - $292,000
--
Bed
2
Baths
1,226
Sq Ft
$224/Sq Ft
Est. Value
About This Home
This home is located at 275 Grove St, Winder, GA 30680 and is currently estimated at $275,099, approximately $224 per square foot. 275 Grove St is a home located in Barrow County with nearby schools including County Line Elementary School, Russell Middle School, and Winder-Barrow High School.
Ownership History
Date
Name
Owned For
Owner Type
Purchase Details
Closed on
Feb 28, 1997
Sold by
Saunders Brad T
Bought by
Smith Albert R and Drummond Kisha
Current Estimated Value
Home Financials for this Owner
Home Financials are based on the most recent Mortgage that was taken out on this home.
Original Mortgage
$79,400
Interest Rate
7.95%
Mortgage Type
New Conventional
Purchase Details
Closed on
Dec 22, 1992
Bought by
Saunders Brad T
Create a Home Valuation Report for This Property
The Home Valuation Report is an in-depth analysis detailing your home's value as well as a comparison with similar homes in the area
Home Values in the Area
Average Home Value in this Area
Purchase History
| Date | Buyer | Sale Price | Title Company |
|---|---|---|---|
| Smith Albert R | $81,900 | -- | |
| Saunders Brad T | -- | -- |
Source: Public Records
Mortgage History
| Date | Status | Borrower | Loan Amount |
|---|---|---|---|
| Previous Owner | Smith Albert R | $79,400 |
Source: Public Records
Tax History Compared to Growth
Tax History
| Year | Tax Paid | Tax Assessment Tax Assessment Total Assessment is a certain percentage of the fair market value that is determined by local assessors to be the total taxable value of land and additions on the property. | Land | Improvement |
|---|---|---|---|---|
| 2024 | $1,832 | $76,634 | $20,000 | $56,634 |
| 2023 | $1,345 | $76,634 | $20,000 | $56,634 |
| 2022 | $1,664 | $55,444 | $18,000 | $37,444 |
| 2021 | $1,391 | $44,516 | $14,400 | $30,116 |
| 2020 | $1,312 | $42,072 | $14,400 | $27,672 |
| 2019 | $1,202 | $36,830 | $11,600 | $25,230 |
| 2018 | $1,194 | $36,830 | $11,600 | $25,230 |
| 2017 | $868 | $29,082 | $8,000 | $21,082 |
| 2016 | $867 | $29,333 | $8,000 | $21,333 |
| 2015 | $876 | $29,583 | $8,000 | $21,583 |
| 2014 | $783 | $27,572 | $5,488 | $22,084 |
| 2013 | -- | $26,548 | $5,488 | $21,060 |
Source: Public Records
Map
Nearby Homes