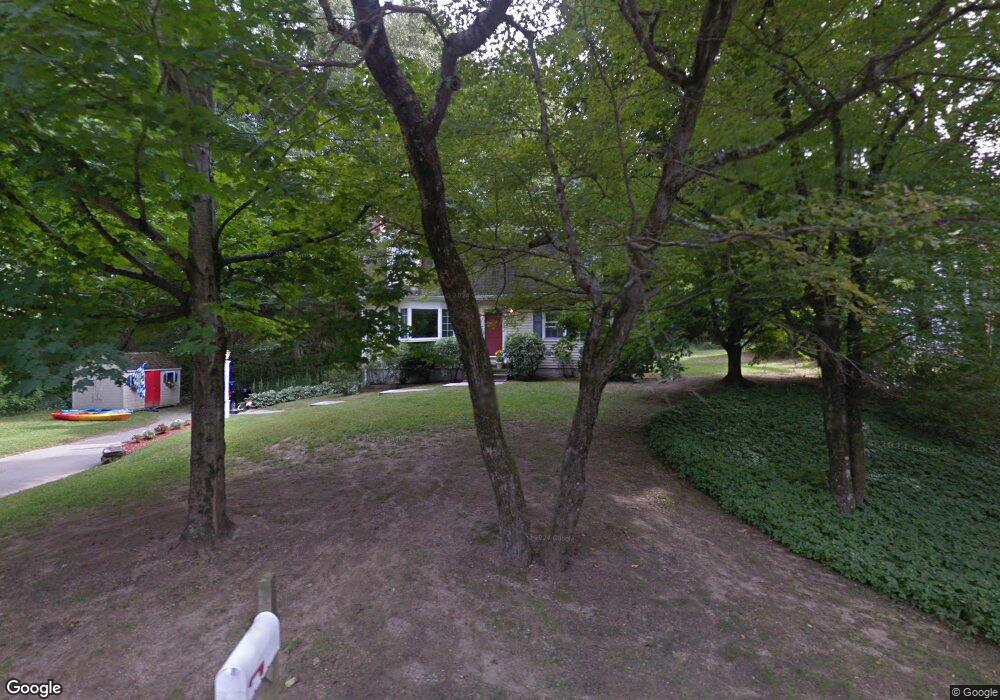
275 Island Rd Millis, MA 02054
Estimated Value: $546,000 - $678,000
3
Beds
3
Baths
1,555
Sq Ft
$395/Sq Ft
Est. Value
About This Home
This home is located at 275 Island Rd, Millis, MA 02054 and is currently estimated at $613,910, approximately $394 per square foot. 275 Island Rd is a home located in Norfolk County with nearby schools including Clyde F Brown, Millis Middle School, and Millis High School.
Ownership History
Date
Name
Owned For
Owner Type
Purchase Details
Closed on
Dec 31, 2024
Sold by
Kessler Lawrence and Kessler Martha W
Bought by
Kessler Martha W
Current Estimated Value
Purchase Details
Closed on
Jan 6, 1987
Sold by
Curran William C
Bought by
Kessler Lawrence
Home Financials for this Owner
Home Financials are based on the most recent Mortgage that was taken out on this home.
Original Mortgage
$145,000
Interest Rate
9.59%
Mortgage Type
Purchase Money Mortgage
Create a Home Valuation Report for This Property
The Home Valuation Report is an in-depth analysis detailing your home's value as well as a comparison with similar homes in the area
Home Values in the Area
Average Home Value in this Area
Purchase History
| Date | Buyer | Sale Price | Title Company |
|---|---|---|---|
| Kessler Martha W | -- | None Available | |
| Kessler Lawrence | $167,000 | -- |
Source: Public Records
Mortgage History
| Date | Status | Borrower | Loan Amount |
|---|---|---|---|
| Previous Owner | Kessler Lawrence | $137,000 | |
| Previous Owner | Kessler Lawrence | $137,000 | |
| Previous Owner | Kessler Lawrence | $145,000 |
Source: Public Records
Tax History
| Year | Tax Paid | Tax Assessment Tax Assessment Total Assessment is a certain percentage of the fair market value that is determined by local assessors to be the total taxable value of land and additions on the property. | Land | Improvement |
|---|---|---|---|---|
| 2025 | $8,013 | $488,600 | $187,200 | $301,400 |
| 2024 | $7,606 | $463,200 | $187,200 | $276,000 |
| 2023 | $7,325 | $418,800 | $162,800 | $256,000 |
| 2022 | $7,188 | $380,700 | $162,800 | $217,900 |
| 2021 | $7,000 | $356,800 | $162,800 | $194,000 |
| 2020 | $7,198 | $357,400 | $152,100 | $205,300 |
| 2019 | $6,336 | $338,800 | $143,100 | $195,700 |
| 2018 | $5,871 | $325,800 | $130,100 | $195,700 |
| 2017 | $5,841 | $317,100 | $133,700 | $183,400 |
| 2016 | $5,530 | $317,100 | $133,700 | $183,400 |
| 2015 | $5,391 | $317,100 | $133,700 | $183,400 |
Source: Public Records
Map
Nearby Homes
- 29 Bridge St
- 11 Parnell St
- 55 West St Unit 3
- 64 Village St
- 2 Lincoln Ct
- 6 Rivendell Ln
- 20 Hemlock Cir
- 25 Bayberry Cir Unit 25
- 6 Beech St
- 324 Union St Unit 1
- 16 Laurel Dr
- 6 Rosenfeld Rd
- 28 Key St Unit 28
- 216 Plain St
- 5 Castle Ave
- 42 Maple Ln
- 26 Maple Ln Unit 26
- 80 Pleasant St
- 82 Pleasant St
- 22 Sunset Way Unit 22
Your Personal Tour Guide
Ask me questions while you tour the home.