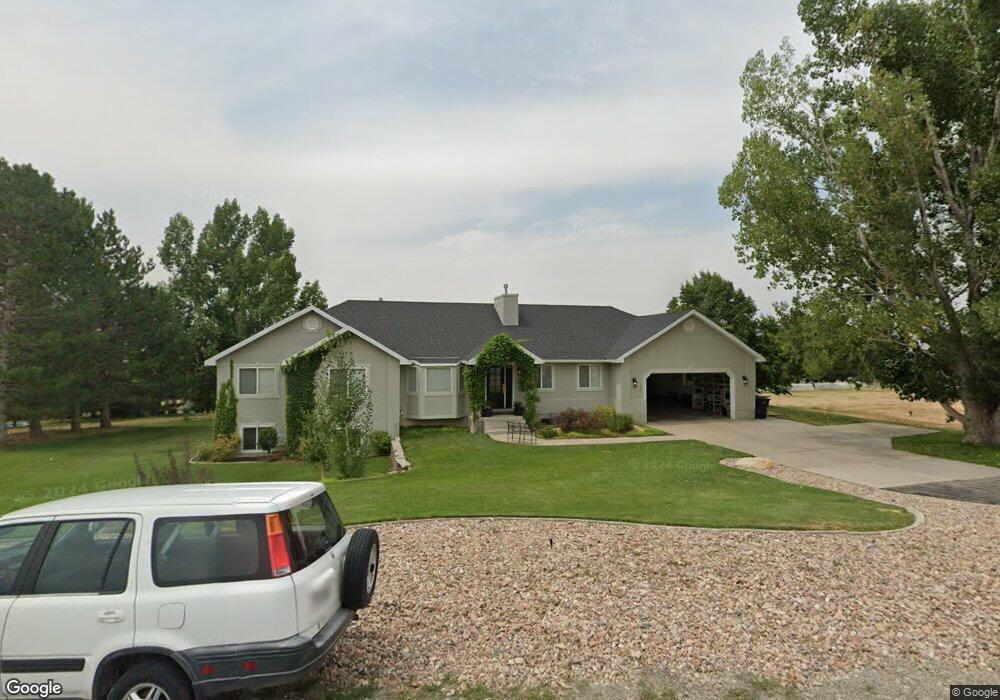
275 N 1000 E Hyde Park, UT 84318
Estimated Value: $668,157 - $851,000
5
Beds
2
Baths
3,500
Sq Ft
$211/Sq Ft
Est. Value
About This Home
This home is located at 275 N 1000 E, Hyde Park, UT 84318 and is currently estimated at $738,789, approximately $211 per square foot. 275 N 1000 E is a home located in Cache County with nearby schools including North Park School, Cedar Ridge School, and North Cache Middle School.
Ownership History
Date
Name
Owned For
Owner Type
Purchase Details
Closed on
Jun 30, 2017
Sold by
Davenport Tim L
Bought by
Bardsley Brett A and Bardsley Alison B
Current Estimated Value
Home Financials for this Owner
Home Financials are based on the most recent Mortgage that was taken out on this home.
Original Mortgage
$263,000
Outstanding Balance
$217,219
Interest Rate
3.94%
Mortgage Type
New Conventional
Estimated Equity
$521,570
Purchase Details
Closed on
Feb 18, 2015
Sold by
Davenport Alisa A
Bought by
Davenport Tim L
Purchase Details
Closed on
Oct 27, 2009
Sold by
Davenport Tim and Davenport Alisa A
Bought by
Davenport Tim L and Davenport Alisa A
Home Financials for this Owner
Home Financials are based on the most recent Mortgage that was taken out on this home.
Original Mortgage
$77,700
Interest Rate
5%
Mortgage Type
New Conventional
Create a Home Valuation Report for This Property
The Home Valuation Report is an in-depth analysis detailing your home's value as well as a comparison with similar homes in the area
Home Values in the Area
Average Home Value in this Area
Purchase History
| Date | Buyer | Sale Price | Title Company |
|---|---|---|---|
| Bardsley Brett A | -- | Pinnacle Title | |
| Davenport Tim L | -- | Cache Title | |
| Davenport Tim L | -- | Pinnacle Title Ins Agency |
Source: Public Records
Mortgage History
| Date | Status | Borrower | Loan Amount |
|---|---|---|---|
| Open | Bardsley Brett A | $263,000 | |
| Previous Owner | Davenport Tim L | $77,700 |
Source: Public Records
Tax History
| Year | Tax Paid | Tax Assessment Tax Assessment Total Assessment is a certain percentage of the fair market value that is determined by local assessors to be the total taxable value of land and additions on the property. | Land | Improvement |
|---|---|---|---|---|
| 2025 | $2,721 | $375,165 | $0 | $0 |
| 2024 | $287 | $364,315 | $0 | $0 |
| 2023 | $2,823 | $341,435 | $0 | $0 |
| 2022 | $2,937 | $341,545 | $0 | $0 |
| 2021 | $2,868 | $512,450 | $113,750 | $398,700 |
| 2020 | $2,526 | $427,787 | $113,750 | $314,037 |
| 2019 | $2,661 | $427,786 | $113,750 | $314,036 |
| 2018 | $2,340 | $367,696 | $93,375 | $274,321 |
| 2017 | $2,289 | $194,810 | $0 | $0 |
| 2016 | $2,323 | $194,810 | $0 | $0 |
| 2015 | $1,978 | $167,670 | $0 | $0 |
| 2014 | $1,927 | $167,670 | $0 | $0 |
| 2013 | -- | $167,670 | $0 | $0 |
Source: Public Records
Map
Nearby Homes
- 940 E Canyon Rd
- 120 N 900 E
- 128 N 900 E
- 898 E 260 N
- 444 N 890 E Unit 179
- 803 E 160 N Unit 1
- 882 E 160 N Unit 4
- 1124 E 160 N Unit 62
- 1153 E 160 N
- 866 E 130 N
- 894 E 130 N Unit 17
- 1154 E 160 N
- 108 N 900 E
- 1087 E 160 N
- 116 N 820 E
- 124 N 1140 E
- 1128 E 50 N Unit 81
- 889 E 600 N
- 458 W Madison St S
- 1130 E 245 N
Your Personal Tour Guide
Ask me questions while you tour the home.