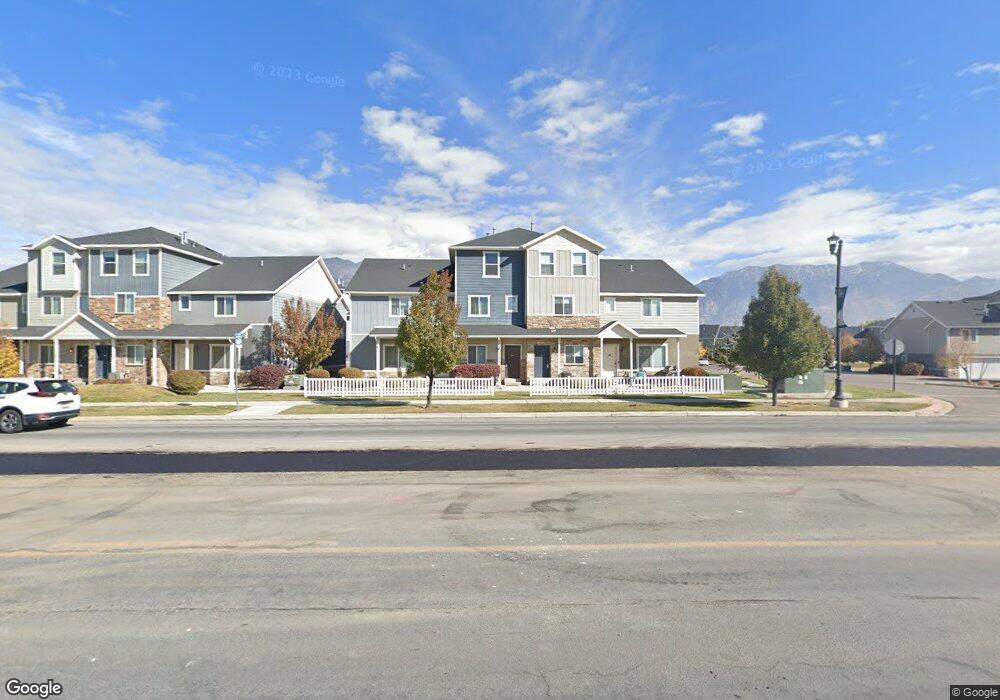
275 N 680 E Vineyard, UT 84059
Estimated Value: $398,605 - $415,000
3
Beds
2
Baths
2,040
Sq Ft
$198/Sq Ft
Est. Value
About This Home
This home is located at 275 N 680 E, Vineyard, UT 84059 and is currently estimated at $404,868, approximately $198 per square foot. 275 N 680 E is a home located in Utah County with nearby schools including Orem Junior High School, Mountain View High School, and Franklin Discovery Academy.
Ownership History
Date
Name
Owned For
Owner Type
Purchase Details
Closed on
Jun 22, 2023
Sold by
Jensen Mccray
Bought by
Hillier David
Current Estimated Value
Home Financials for this Owner
Home Financials are based on the most recent Mortgage that was taken out on this home.
Original Mortgage
$331,920
Outstanding Balance
$322,979
Interest Rate
6.35%
Mortgage Type
New Conventional
Estimated Equity
$81,889
Purchase Details
Closed on
Mar 25, 2019
Sold by
Donner Ellen and Donner Sean
Bought by
Jensen Mccray
Home Financials for this Owner
Home Financials are based on the most recent Mortgage that was taken out on this home.
Original Mortgage
$240,463
Interest Rate
3.12%
Mortgage Type
FHA
Purchase Details
Closed on
Apr 21, 2015
Sold by
Ep1lc Llc
Bought by
Donner Ellen and Donner Sean
Home Financials for this Owner
Home Financials are based on the most recent Mortgage that was taken out on this home.
Original Mortgage
$175,403
Interest Rate
4.5%
Mortgage Type
FHA
Create a Home Valuation Report for This Property
The Home Valuation Report is an in-depth analysis detailing your home's value as well as a comparison with similar homes in the area
Home Values in the Area
Average Home Value in this Area
Purchase History
| Date | Buyer | Sale Price | Title Company |
|---|---|---|---|
| Hillier David | -- | Title One | |
| Jensen Mccray | -- | Vanguard Title Ins Agcy Llc | |
| Donner Ellen | -- | Union Title |
Source: Public Records
Mortgage History
| Date | Status | Borrower | Loan Amount |
|---|---|---|---|
| Open | Hillier David | $331,920 | |
| Previous Owner | Jensen Mccray | $240,463 | |
| Previous Owner | Donner Ellen | $175,403 |
Source: Public Records
Tax History
| Year | Tax Paid | Tax Assessment Tax Assessment Total Assessment is a certain percentage of the fair market value that is determined by local assessors to be the total taxable value of land and additions on the property. | Land | Improvement |
|---|---|---|---|---|
| 2025 | $2,242 | $206,415 | -- | -- |
| 2024 | $2,242 | $210,320 | $0 | $0 |
| 2023 | $1,874 | $196,460 | $0 | $0 |
| 2022 | $1,934 | $197,065 | $0 | $0 |
| 2021 | $1,696 | $264,900 | $39,700 | $225,200 |
| 2020 | $1,642 | $256,200 | $38,400 | $217,800 |
| 2019 | $1,462 | $235,100 | $35,300 | $199,800 |
| 2018 | $1,455 | $215,100 | $32,300 | $182,800 |
| 2017 | $1,394 | $111,100 | $0 | $0 |
| 2016 | $1,401 | $111,100 | $0 | $0 |
| 2015 | $1,395 | $111,100 | $0 | $0 |
Source: Public Records
Map
Nearby Homes
- 266 N 725 E
- 341 N 680 E
- 280 N 750 E
- 624 E 300 N Unit 3
- 266 N 590 E Unit Building 6
- 266 N 590 E Unit 6
- 206 N 750 E
- 283 N 590 E
- 212 N 590 E
- 78 N Scarlet Maple Dr Unit 4304
- 235 N 590 E
- 56 N Rue de Matth
- 422 E 360 North St
- 579 N 290 E
- 1225 W 160 N
- 224 E 630 N
- 171 E 580 N
- 152 E 580 N
- 132 E Annual Way
- 222 N 1200 W Unit 144
Your Personal Tour Guide
Ask me questions while you tour the home.