275 Pond St Dunstable, MA 01827
Estimated Value: $1,377,000 - $1,952,000
6
Beds
4
Baths
5,255
Sq Ft
$313/Sq Ft
Est. Value
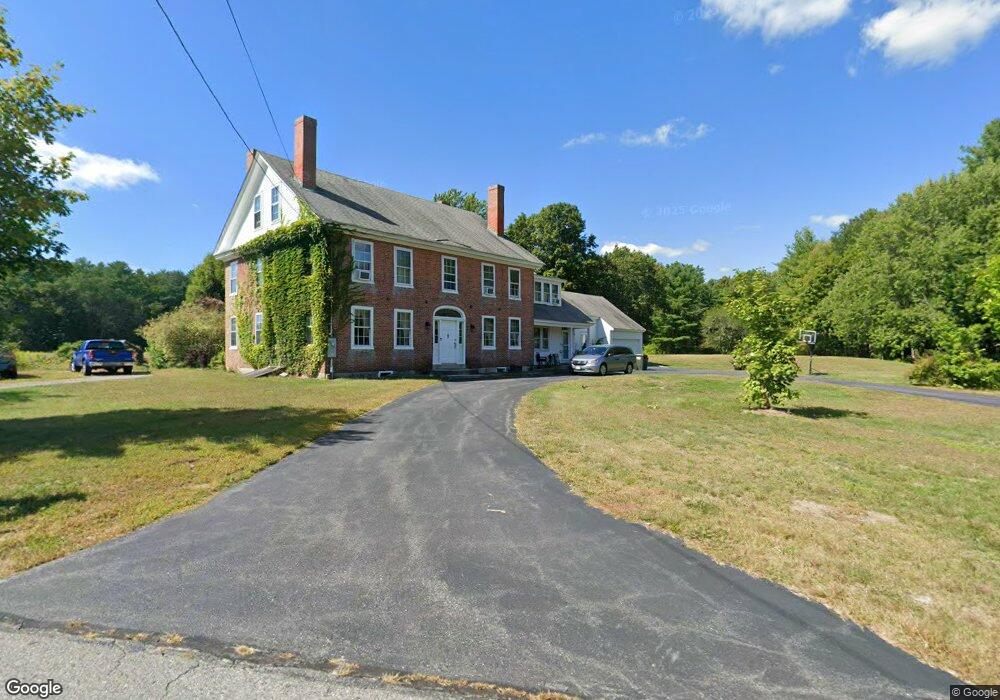
About This Home
This home is located at 275 Pond St, Dunstable, MA 01827 and is currently estimated at $1,645,447, approximately $313 per square foot. 275 Pond St is a home located in Middlesex County with nearby schools including Groton Dunstable Regional High School.
Ownership History
Date
Name
Owned For
Owner Type
Purchase Details
Closed on
Jun 8, 2017
Sold by
Krishnaswamy Sarath and Landsman Susan
Bought by
Krishnaswamy Sarath
Current Estimated Value
Purchase Details
Closed on
Mar 15, 2002
Sold by
Holmes Muriel E
Bought by
Krishnaswamy Sarath and Landsman Susan
Create a Home Valuation Report for This Property
The Home Valuation Report is an in-depth analysis detailing your home's value as well as a comparison with similar homes in the area
Home Values in the Area
Average Home Value in this Area
Purchase History
| Date | Buyer | Sale Price | Title Company |
|---|---|---|---|
| Krishnaswamy Sarath | -- | -- | |
| Krishnaswamy Sarath | $922,000 | -- |
Source: Public Records
Mortgage History
| Date | Status | Borrower | Loan Amount |
|---|---|---|---|
| Previous Owner | Krishnaswamy Sarath | $350,000 | |
| Previous Owner | Krishnaswamy Sarath | $458,000 |
Source: Public Records
Tax History Compared to Growth
Tax History
| Year | Tax Paid | Tax Assessment Tax Assessment Total Assessment is a certain percentage of the fair market value that is determined by local assessors to be the total taxable value of land and additions on the property. | Land | Improvement |
|---|---|---|---|---|
| 2025 | $18,714 | $1,361,000 | $357,100 | $1,003,900 |
| 2024 | $16,142 | $1,156,300 | $308,500 | $847,800 |
| 2023 | $16,410 | $1,096,200 | $308,500 | $787,700 |
| 2022 | $14,786 | $969,600 | $308,500 | $661,100 |
| 2021 | $15,220 | $927,500 | $276,100 | $651,400 |
| 2020 | $14,733 | $874,900 | $276,100 | $598,800 |
| 2019 | $14,922 | $874,700 | $276,100 | $598,600 |
| 2018 | $14,269 | $813,500 | $260,000 | $553,500 |
| 2017 | $13,846 | $813,500 | $260,000 | $553,500 |
| 2016 | $13,202 | $797,700 | $251,800 | $545,900 |
| 2015 | $13,260 | $792,600 | $239,100 | $553,500 |
| 2014 | $12,457 | $789,900 | $239,100 | $550,800 |
Source: Public Records
Map
Nearby Homes
- 153 Off Pond St
- 446 Westford St
- 319 Pleasant St
- 660 Old Dunstable Rd
- 0 Lowell St
- 45 Red Gate Rd
- 2 Wildflower Ln
- 6 Ingalls Rd
- 18 Ingalls Rd
- 11 Old Hickory Rd
- 454 Dunstable Rd
- 8 Jamie Rd
- 0 Old Dunstable Rd
- 19 Sandstone Rd
- 7 Axletree Rd
- 160 Westford Rd
- 15 Stone Ridge Rd
- 17 Cannongate Rd Unit 87
- 20 Highland Rd
- 22 Highland Rd