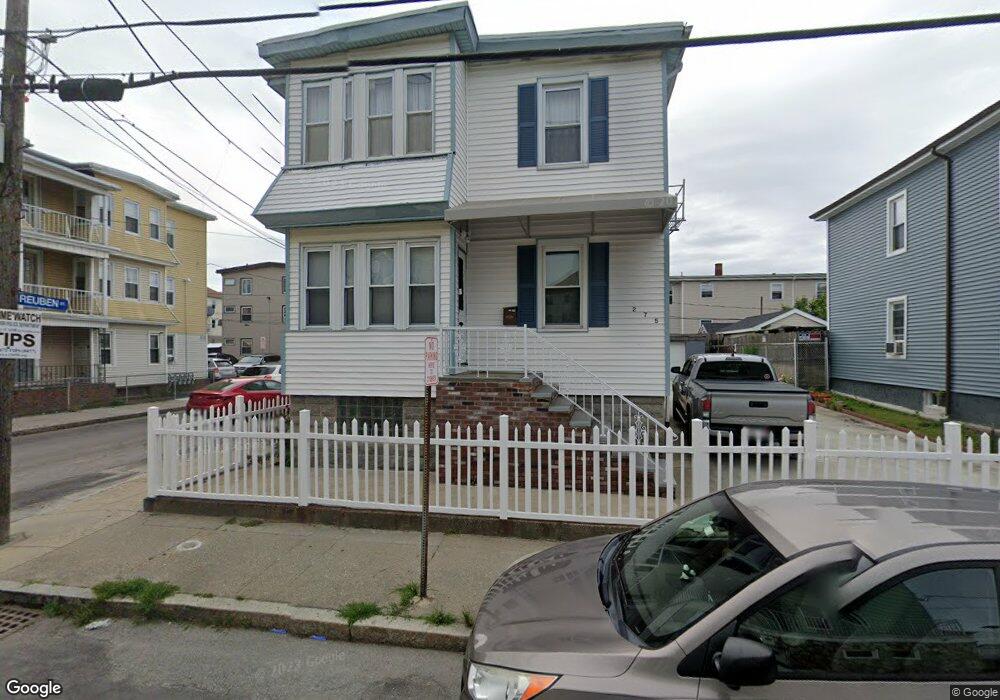
275 Quequechan St Fall River, MA 02723
Flint NeighborhoodEstimated Value: $392,369 - $604,000
6
Beds
2
Baths
1,638
Sq Ft
$288/Sq Ft
Est. Value
About This Home
This home is located at 275 Quequechan St, Fall River, MA 02723 and is currently estimated at $471,092, approximately $287 per square foot. 275 Quequechan St is a home located in Bristol County with nearby schools including Samuel Watson, Talbot Innovation School, and B M C Durfee High School.
Ownership History
Date
Name
Owned For
Owner Type
Purchase Details
Closed on
Dec 9, 2020
Sold by
Bun Sovann and Bun Sokun Seap
Bought by
Sok Samdy and Boun Ratna
Current Estimated Value
Purchase Details
Closed on
Jul 9, 2003
Sold by
Assad Aseeb S and Assad Barbara A
Bought by
Sokun Seap and Bun Sovann
Home Financials for this Owner
Home Financials are based on the most recent Mortgage that was taken out on this home.
Original Mortgage
$128,000
Interest Rate
5.45%
Mortgage Type
Purchase Money Mortgage
Create a Home Valuation Report for This Property
The Home Valuation Report is an in-depth analysis detailing your home's value as well as a comparison with similar homes in the area
Home Values in the Area
Average Home Value in this Area
Purchase History
| Date | Buyer | Sale Price | Title Company |
|---|---|---|---|
| Sok Samdy | -- | None Available | |
| Sokun Seap | $160,000 | -- |
Source: Public Records
Mortgage History
| Date | Status | Borrower | Loan Amount |
|---|---|---|---|
| Previous Owner | Sokun Seap | $128,000 |
Source: Public Records
Tax History
| Year | Tax Paid | Tax Assessment Tax Assessment Total Assessment is a certain percentage of the fair market value that is determined by local assessors to be the total taxable value of land and additions on the property. | Land | Improvement |
|---|---|---|---|---|
| 2025 | $3,928 | $343,100 | $101,800 | $241,300 |
| 2024 | $3,586 | $312,100 | $95,100 | $217,000 |
| 2023 | $3,253 | $265,100 | $79,800 | $185,300 |
| 2022 | $3,033 | $240,300 | $75,900 | $164,400 |
| 2021 | $2,758 | $199,400 | $72,700 | $126,700 |
| 2020 | $2,503 | $173,200 | $70,300 | $102,900 |
| 2019 | $2,425 | $166,300 | $70,300 | $96,000 |
| 2018 | $2,338 | $159,900 | $74,500 | $85,400 |
| 2017 | $2,180 | $155,700 | $74,500 | $81,200 |
| 2016 | $2,323 | $170,400 | $91,100 | $79,300 |
| 2015 | $2,183 | $166,900 | $87,600 | $79,300 |
| 2014 | $2,302 | $183,000 | $97,300 | $85,700 |
Source: Public Records
Map
Nearby Homes
- 25 Lebanon St Unit D
- 25 Lebanon St Unit C
- 1244 Pleasant St
- 1155-1157 Pleasant St
- 152 Alden St
- 88 Harrison St Unit 5
- 178 Thomas St
- 70 Jencks St
- 129 County St
- 847 Pleasant St
- 529 Eastern Ave
- 31 Choate St
- 144 Choate St
- 366 Alden St
- 165 Eastern Ave
- 580 County St
- 139 Quarry St
- 150 Downing St
- 10 Carlisa Dr
- 712 Eastern Ave
- 75 Reuben St
- 75 Reuben St Unit 4
- 75 Reuben St Unit 1
- 253 Quequechan St
- 75 Reuben St Unit 2
- 266 Quequechan St
- 299 Quequechan St
- 272 Quequechan St
- 55 Reuben St Unit 6
- 55 Reuben St
- 258 Quequechan St
- 278 Quequechan St
- 301 Quequechan St Unit 2s
- 245 Quequechan St
- 252 Quequechan St
- 43 Reuben St Unit 3
- 43 Reuben St Unit 1
- 43 Reuben St Unit 2
- 43 Reuben St
- 246 Quequechan St
Your Personal Tour Guide
Ask me questions while you tour the home.