275 Quequechan St Fall River, MA 02723
Flint NeighborhoodEstimated Value: $352,000 - $597,000
About This Home
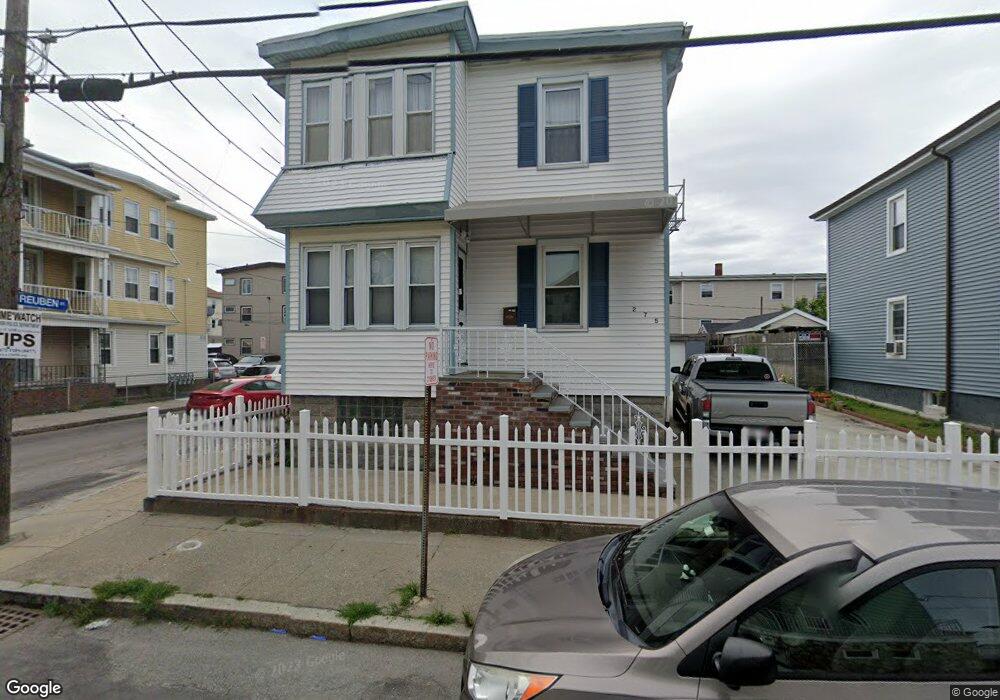
This home is located at 275 Quequechan St, Fall River, MA 02723 and is currently estimated at $444,499, approximately $271 per square foot. 275 Quequechan St is a home located in Bristol County with nearby schools including Samuel Watson, Talbot Innovation School, and B M C Durfee High School.
Ownership History
We collect this data history from publicly available records. To have your information removed, we recommend requesting removal directly through your county’s website.
Purchase Details
Purchase Details
Home Values in the Area
Average Home Value in this Area
Purchase History
We collect this data history from publicly available records. To have your information removed, we recommend requesting removal directly through your county’s website.
| Date | Buyer | Sale Price | Title Company |
|---|---|---|---|
| -- | None Available | ||
| $160,000 | -- |
Mortgage History
We collect this data history from publicly available records. To have your information removed, we recommend requesting removal directly through your county’s website.
| Date | Status | Borrower | Loan Amount |
|---|---|---|---|
| Previous Owner | $130,000 |
Tax History
We collect this data history from publicly available records. To have your information removed, we recommend requesting removal directly through your county’s website.
| Year | Tax Paid | Tax Assessment Tax Assessment Total Assessment is a certain percentage of the fair market value that is determined by local assessors to be the total taxable value of land and additions on the property. | Land | Improvement |
|---|---|---|---|---|
| 2025 | $3,928 | $343,100 | $101,800 | $241,300 |
| 2024 | $3,586 | $312,100 | $95,100 | $217,000 |
| 2023 | $3,253 | $265,100 | $79,800 | $185,300 |
| 2022 | $3,033 | $240,300 | $75,900 | $164,400 |
| 2021 | $2,758 | $199,400 | $72,700 | $126,700 |
| 2020 | $2,503 | $173,200 | $70,300 | $102,900 |
| 2019 | $2,425 | $166,300 | $70,300 | $96,000 |
| 2018 | $2,338 | $159,900 | $74,500 | $85,400 |
| 2017 | $2,180 | $155,700 | $74,500 | $81,200 |
| 2016 | $2,323 | $170,400 | $91,100 | $79,300 |
| 2015 | $2,183 | $166,900 | $87,600 | $79,300 |
| 2014 | $2,302 | $183,000 | $97,300 | $85,700 |
Map
- 301 Quequechan St Unit 2s
- 75 Reuben St Unit 2
- 75 Reuben St
- 75 Reuben St Unit 4
- 75 Reuben St Unit 1
- 299 Quequechan St
- 313 Quequechan St
- 55 Reuben St Unit 6
- 55 Reuben St
- 324 Quequechan St
- 278 Quequechan St
- 43 Reuben St Unit 3
- 43 Reuben St Unit 1
- 43 Reuben St Unit 2
- 43 Reuben St
- 334 Quequechan St
- 272 Quequechan St
- 267 Quequechan St
- 341 Quequechan St
- 266 Quequechan St
Ask me questions while you tour the home.